


September – The Worst Month for the S&P 500
FXOpen

August was a turbulent month for the US stock market. On the 5th, the S&P 500 (US SPX 500 mini on FXOpen) experienced its largest daily drop since 2022, falling by 3%. However, the index ended August up by 3.7% and is now just 0.3% below its all-time high of around 5672 set in July.
What can we expect in September? Historically, it is the worst month for the S&P 500 (US SPX 500 mini on FXOpen). Statistics show that the index has typically declined by an average of 1.1% in September.
The month starts with a long weekend due to Labour Day in the US, but volatility is likely to increase as traders return from their holidays.
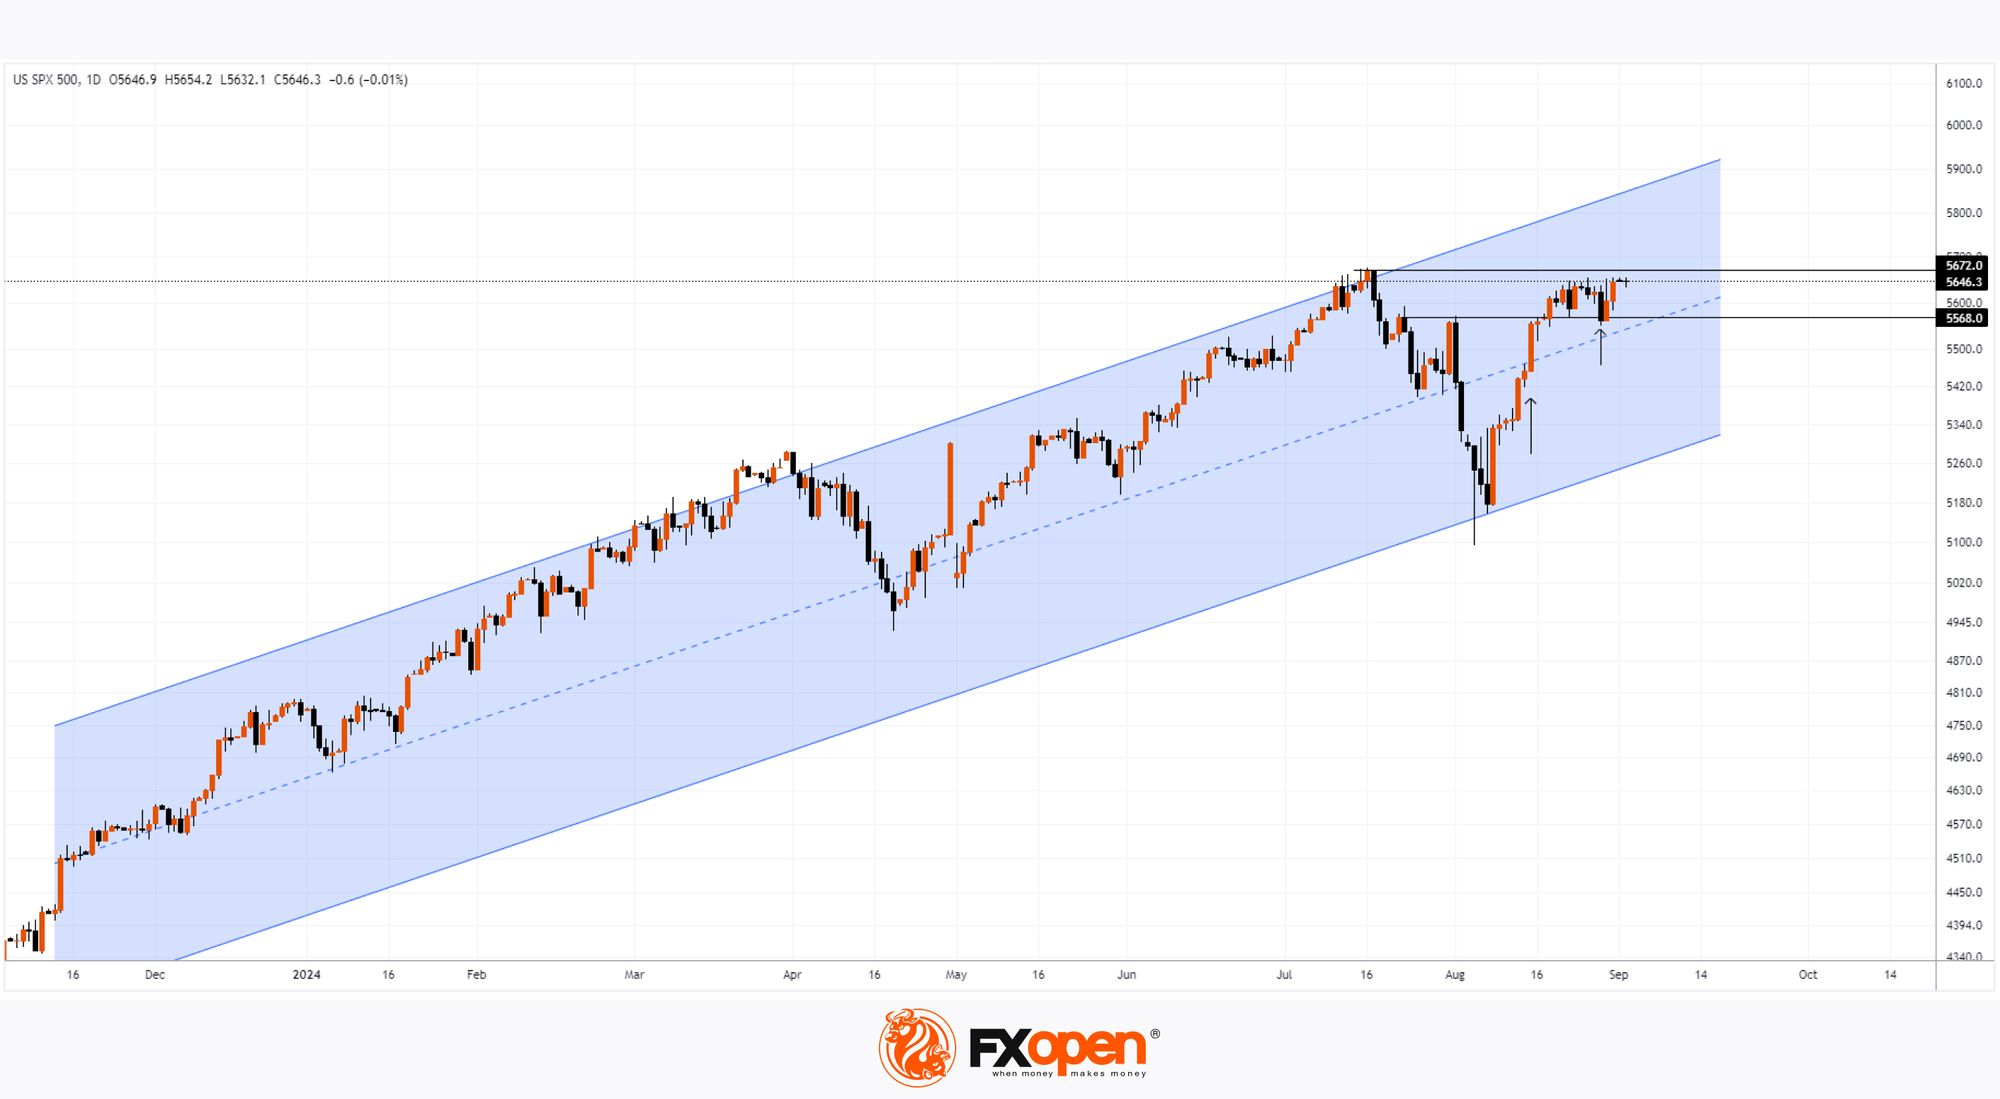
Technical analysis of the S&P 500 (US SPX 500 mini on FXOpen) shows:
→ The price is moving within an ascending channel (shown in blue), having tested the lower boundary of the channel on 5 August before returning to the upper half of the channel with a wide candle on 15 August (shown by the arrow).
→ The level of 5568, which showed signs of resistance at the end of July and early August, was broken to the upside on the 19th. This level, now "reinforced" by the median line of the channel, could serve as a base for bulls trying to set a new all-time high. If such an attempt occurs, it is possible that the price will reach the upper boundary of the channel, where resistance is expected.
→ The bears' attempt to lower the price on 28 August (second arrow) failed, further indicating that the bullish side has the upper hand.
Thus, the start of the month looks promising, but the fundamental backdrop will be crucial.
The key event for September is the Fed meeting on the 18th, where a 0.25% rate cut is anticipated – currently, the rate stands at a 23-year high of 5.5%. However, market sentiment may shift depending on the employment report for August, scheduled for release on 6 September.
Trade global index CFDs with zero commission and tight spreads (additional fees may apply). Open your FXOpen account now or learn more about trading index CFDs with FXOpen.
This article represents the opinion of the Companies operating under the FXOpen brand only. It is not to be construed as an offer, solicitation, or recommendation with respect to products and services provided by the Companies operating under the FXOpen brand, nor is it to be considered financial advice.
Stay ahead of the market!
Subscribe now to our mailing list and receive the latest market news and insights delivered directly to your inbox.


Latest articles


Market Repricing of Risk as Gold Loses Safe-Haven Demand
Geopolitical tensions in the Middle East had remained the primary macro driver for the gold market over recent weeks; however, on 8 April the situation shifted sharply as the United States and Iran agreed to a temporary two-week ceasefire, including

Commodity Currencies on the Rise: Market Focus Shifts to US and Canadian Data
Commodity-linked currencies continue to strengthen, while the US dollar remains under pressure amid easing geopolitical tensions and a shift in investor preference towards riskier assets. Reports of a temporary ceasefire between the US and Iran have helped stabilise sentiment and