


Silver Price Hits 14-Year High
FXOpen
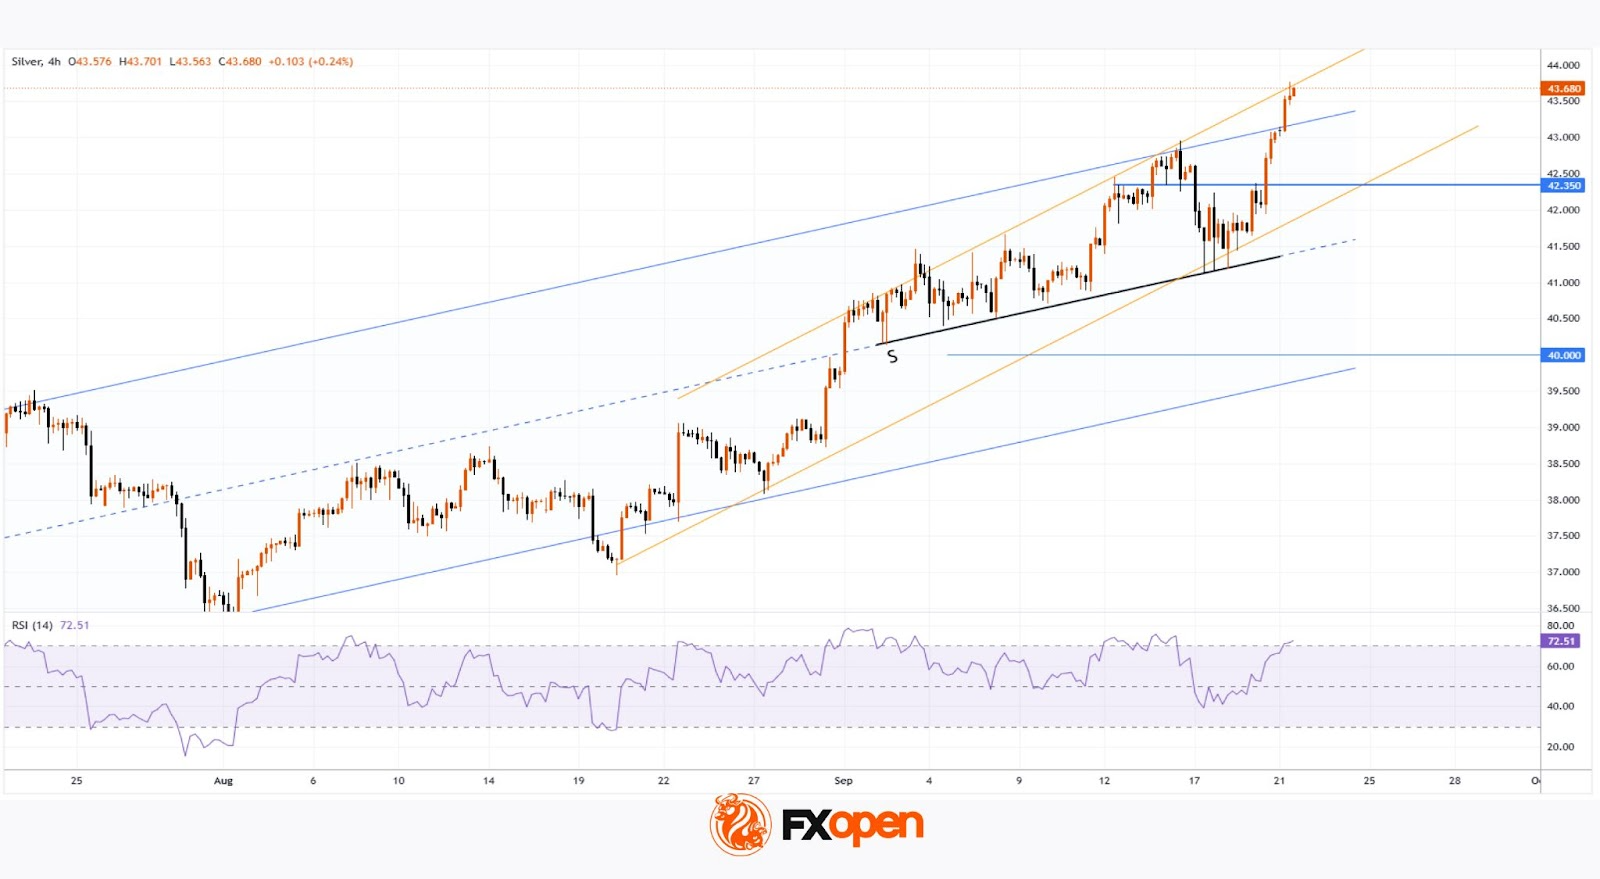
As shown on the XAG/USD chart, today the price of silver has climbed above $43.60 per ounce for the first time since 2011.
This may reflect expectations that the recent Federal Reserve interest rate cut will provide a boost to the global economy, where demand for silver is strengthening due to the growth of sectors such as solar energy, electric vehicles, and electronics. In addition, XAG/USD gains further support from gold, which today set a new record high above $3,720.
Technical Analysis of the XAG/USD Chart
When analysing XAG/USD price movements earlier this month, we:
→ drew an ascending blue channel;
→ noted that silver had encountered a resistance block;
→ suggested a possible corrective scenario towards the psychological $40 level.
Since then, the black line (S) has:
→ proved itself as a strong support level, preventing a decline towards $40;
→ provided enough local pivot points to update the slope of the blue channel.
As of today, silver has broken above the upper boundary of this channel (highlighting strong demand). At the same time:
→ the RSI indicator is in overbought territory;
→ the price is positioned at the upper boundary of a steeper short-term uptrend, plotted from fluctuations over the past month (shown in orange).
Thus, we could assume that XAG/USD is currently vulnerable to a correction following a nearly 10% rally since the beginning of the month, as buyers are likely tempted to take profits.
Should a pullback occur in the near term, silver may find support:
→ around $42.35 – a level that has repeatedly switched roles between resistance and support;
→ at the lower boundary of the orange channel.
Looking further ahead, we may well witness fresh records for both silver and gold before year-end – particularly if the news flow continues to fuel trader expectations of additional Fed rate cuts and inflation concerns persist.
Start trading commodity CFDs with tight spreads (additional fees may apply). Open your trading account now or learn more about trading commodity CFDs with FXOpen.
This article represents the opinion of the Companies operating under the FXOpen brand only. It is not to be construed as an offer, solicitation, or recommendation with respect to products and services provided by the Companies operating under the FXOpen brand, nor is it to be considered financial advice.
Stay ahead of the market!
Subscribe now to our mailing list and receive the latest market news and insights delivered directly to your inbox.


Latest articles


Market Repricing of Risk as Gold Loses Safe-Haven Demand
Geopolitical tensions in the Middle East had remained the primary macro driver for the gold market over recent weeks; however, on 8 April the situation shifted sharply as the United States and Iran agreed to a temporary two-week ceasefire, including

Commodity Currencies on the Rise: Market Focus Shifts to US and Canadian Data
Commodity-linked currencies continue to strengthen, while the US dollar remains under pressure amid easing geopolitical tensions and a shift in investor preference towards riskier assets. Reports of a temporary ceasefire between the US and Iran have helped stabilise sentiment and