


FXOpen

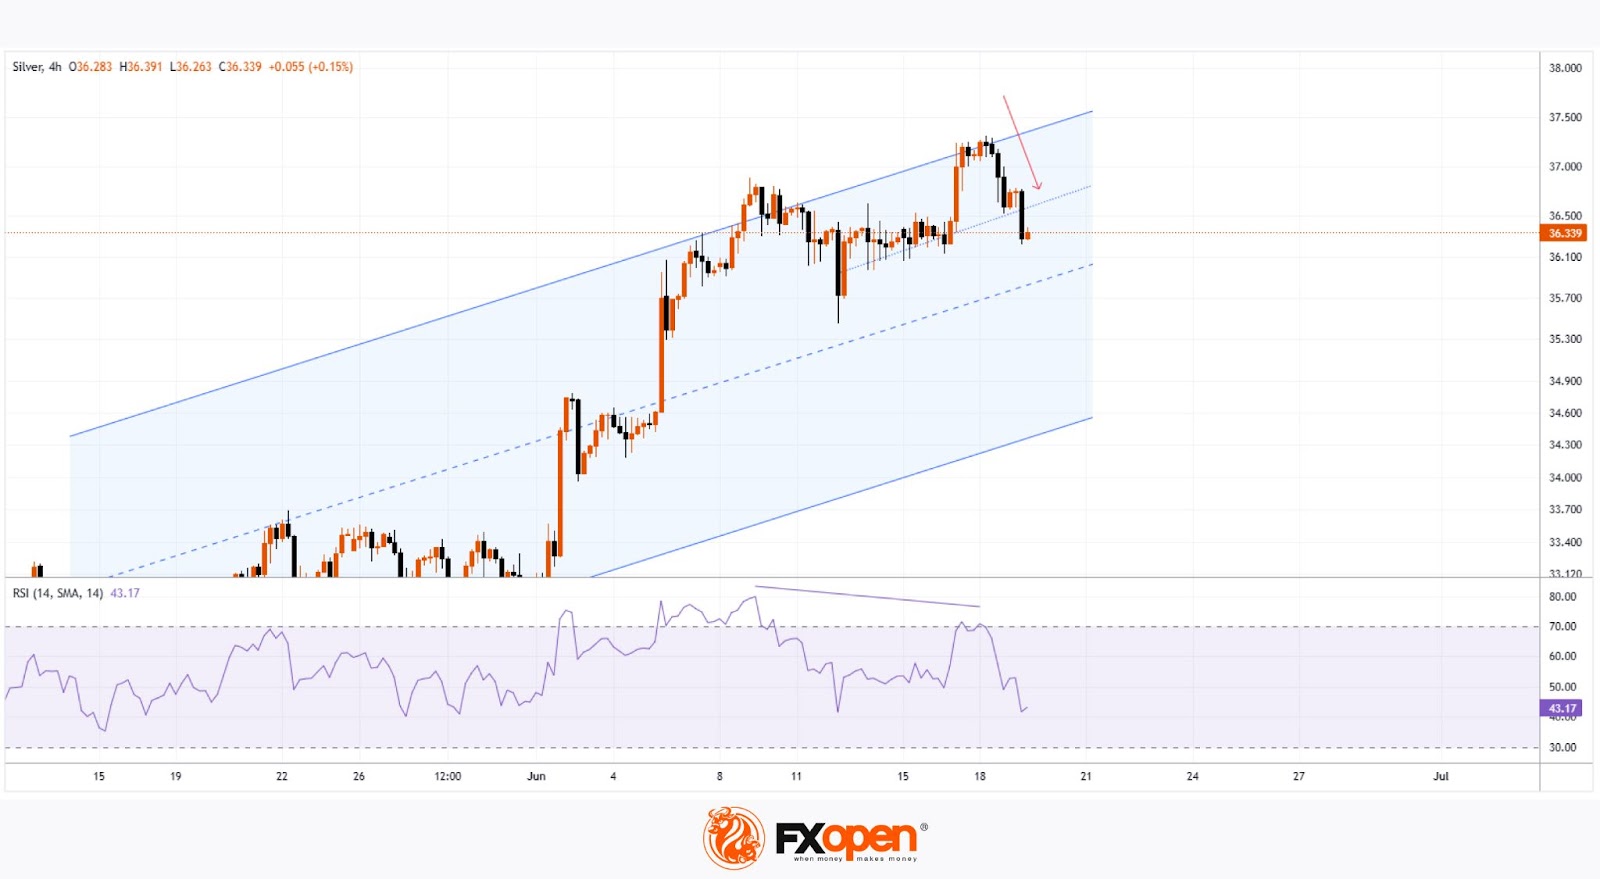
As shown on the XAG/USD chart, the price of silver climbed above $37 per ounce yesterday — a level not seen since 2012. However, this morning, the price has dropped by approximately 2.5% from yesterday’s peak.
The bullish driver behind the rally has been fears that the US could become involved in a military conflict between Israel and Iran. Concerns in financial markets intensified after media reports stated that US officials are preparing for a potential strike on Iran.
Another factor influencing silver's price was the Federal Reserve’s decision to keep interest rates unchanged and maintain a cautious policy stance. Yesterday, Jerome Powell warned that President Trump’s tariffs could fuel inflation (a bullish signal for silver) and complicate the economic outlook.
Technical Analysis of the XAG/USD Chart
In our previous analysis of the XAG/USD chart, we identified an upward channel. This channel remains relevant, though its configuration has shifted.
The price of silver remains in the upper part of the channel (a sign of strong demand). However, two signals suggest a potential correction may develop:
→ A bearish divergence on the RSI indicator;
→ A sharp decline from the channel’s upper boundary (marked with a red arrow), breaking through the local line that divides the upper half of the channel into quarters.
Nevertheless, given the scale of geopolitical risks, there is a chance that the bears may struggle to significantly shift the trend — especially with markets nearing the weekend closure.
Start trading commodity CFDs with tight spreads (additional fees may apply). Open your trading account now or learn more about trading commodity CFDs with FXOpen.
This article represents the opinion of the Companies operating under the FXOpen brand only. It is not to be construed as an offer, solicitation, or recommendation with respect to products and services provided by the Companies operating under the FXOpen brand, nor is it to be considered financial advice.
Stay ahead of the market!
Subscribe now to our mailing list and receive the latest market news and insights delivered directly to your inbox.


Latest articles
Weekend Trading: Market Access, Liquidity, and Trading Conditions
Weekend trading refers to market activity outside

AUD/USD Falls Below Key Support
As the AUD/USD chart indicates, the Australian dollar is showing weakness against the US dollar at the start of the week. Notably, we are seeing a bearish breakout below the lower boundary of an important ascending channel that had

Gold Price Falls to 2026 Low
As the XAU/USD chart indicates, today, shortly after the start of the trading week, gold fell below $4,150 (the low of the year). The last time prices were at this level was in early December 2025, before the