


Silver Price Retreats from a 14-Year High
FXOpen
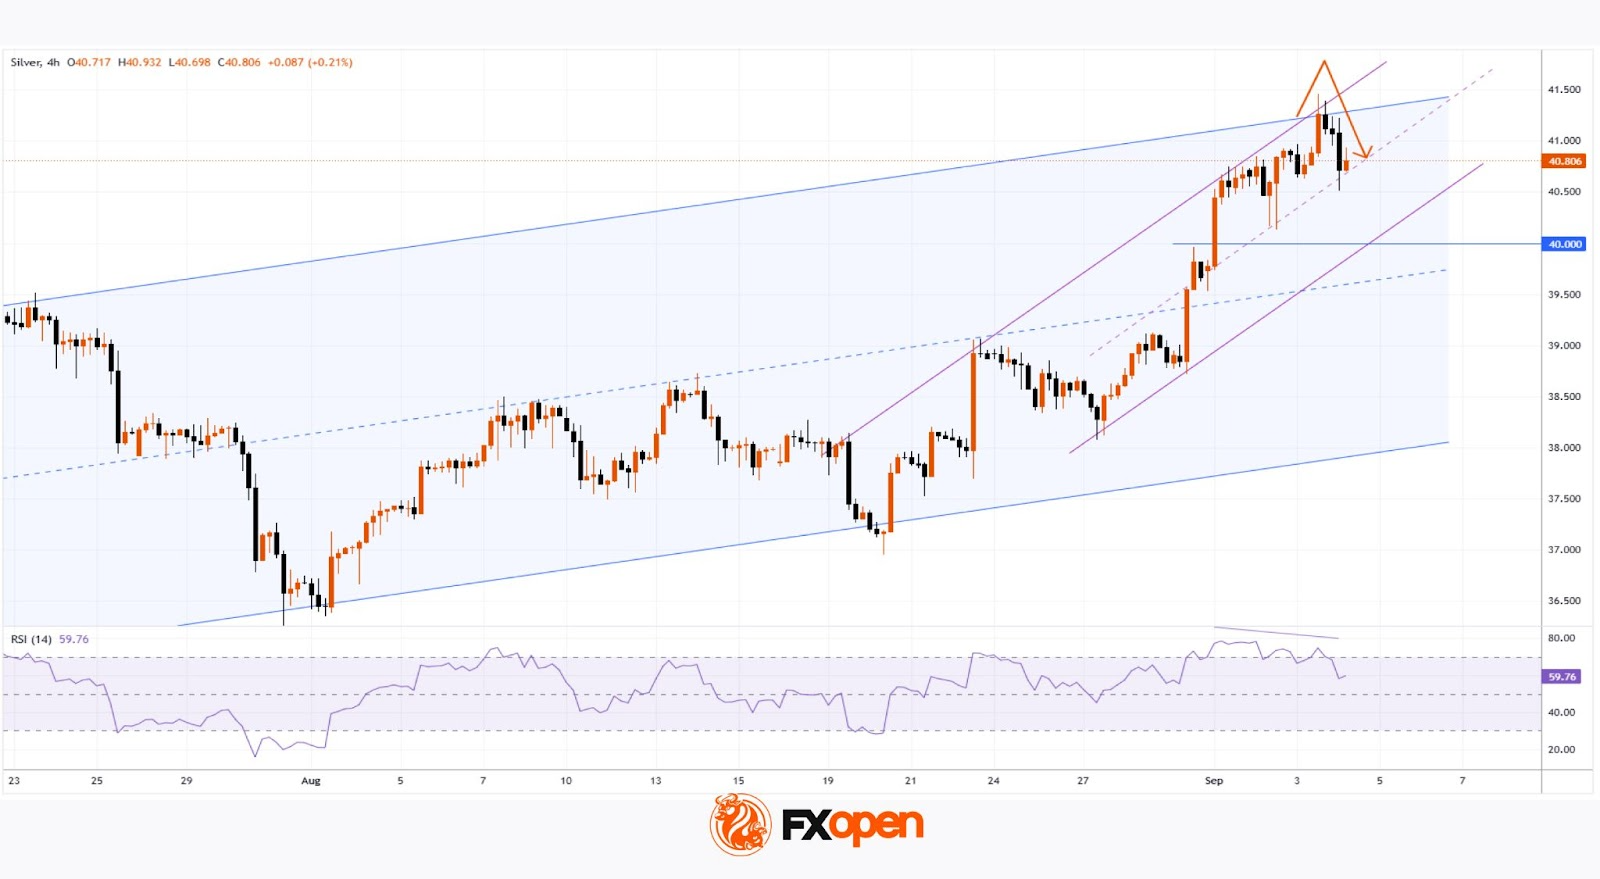
As the XAG/USD chart shows, yesterday silver climbed above $41.40 per ounce. The last time silver traded at this level was in September 2011. The rise in XAG/USD was supported by gold surging to a record high, which we reported yesterday.
Furthermore, Goldman Sachs analysts have issued a gold price forecast for mid-2026, according to which XAU/USD could rise to:
→ $4,000 under the base case;
→ $5,000 if 1% of the private US Treasury market flows into gold. This scenario would imply a loss of Federal Reserve independence, higher inflation, and the US dollar weakening as a so-called reserve currency.
Technical Analysis of XAG/USD
Analysing XAG/USD fluctuations, we can identify two ascending channels:
→ Medium-term (shown in blue): in play since early summer;
→ Short-term (shown in purple): reflecting increased demand over the past two weeks.
Within this context, it is evident that silver has encountered a resistance cluster formed by the upper boundaries of these channels. For short- and medium-term traders, this suggests that XAG/USD may be considered overvalued → potentially triggering a wave of profit-taking on long positions.
Signs of demand exhaustion include:
→ A bearish divergence on the RSI indicator;
→ The aggressive decline from the upper channel boundary (highlighted by the orange arrow).
Bulls may find support at the median line and lower boundary of the purple channel.
Given the above, we might assume that the purple channel could still sustain silver’s upward momentum by inertia. At the same time, the formation of a bearish reversal pattern (e.g. a double top) near the upper blue boundary could occur, followed by a correction towards the psychological $40 level (where a buyer imbalance was previously observed).
Start trading commodity CFDs with tight spreads (additional fees may apply). Open your trading account now or learn more about trading commodity CFDs with FXOpen.
This article represents the opinion of the Companies operating under the FXOpen brand only. It is not to be construed as an offer, solicitation, or recommendation with respect to products and services provided by the Companies operating under the FXOpen brand, nor is it to be considered financial advice.
Stay ahead of the market!
Subscribe now to our mailing list and receive the latest market news and insights delivered directly to your inbox.


Latest articles


Market Repricing of Risk as Gold Loses Safe-Haven Demand
Geopolitical tensions in the Middle East had remained the primary macro driver for the gold market over recent weeks; however, on 8 April the situation shifted sharply as the United States and Iran agreed to a temporary two-week ceasefire, including

Commodity Currencies on the Rise: Market Focus Shifts to US and Canadian Data
Commodity-linked currencies continue to strengthen, while the US dollar remains under pressure amid easing geopolitical tensions and a shift in investor preference towards riskier assets. Reports of a temporary ceasefire between the US and Iran have helped stabilise sentiment and