


FXOpen

As the XAG/USD chart shows, earlier this morning the price of one ounce of silver reached above $83 for the first time. However, this move was followed by an abnormally sharp reversal to the downside.
Why Did the Silver Price Fall?
On 24 December, we not only outlined the fundamental backdrop but also highlighted that the market was vulnerable to sharp price movements due to reduced liquidity during the holiday period.
Now, as the ATR indicator has surged sharply higher—confirming our assumption—it is worth examining the key chart details that point to emerging bearish signals.
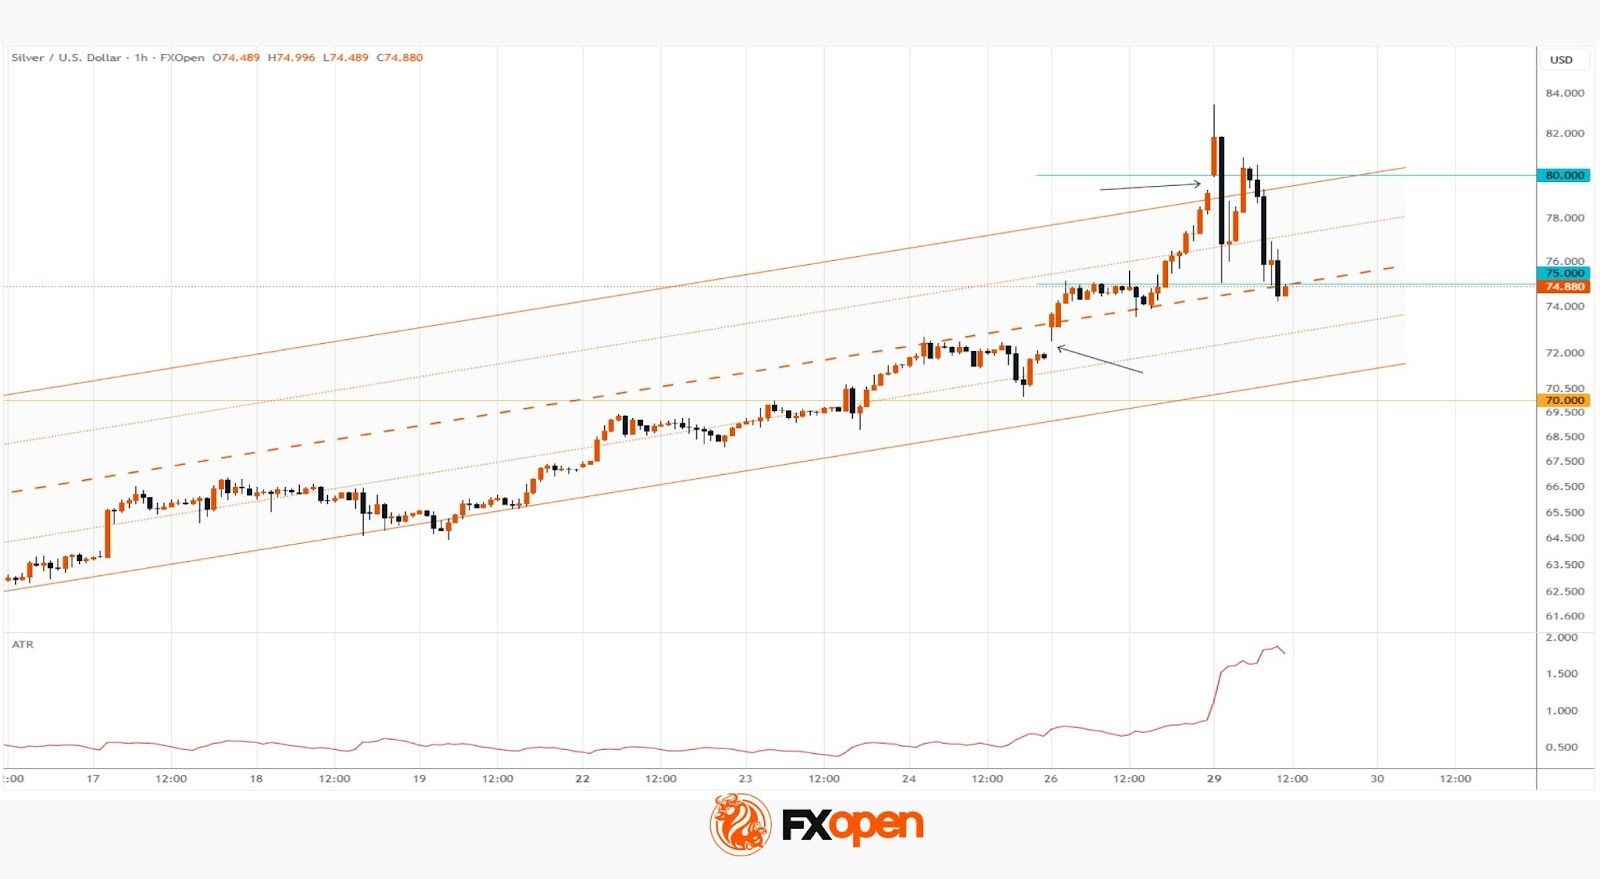
Technical Analysis of the XAG/USD Chart
The previously constructed ascending channel (highlighted in orange) has retained its slope, while the following developments occurred:
→ The silver price surge on 26 December (marked by the arrow), with a bullish gap, doubled the ascending channel.
→ At the open of today’s trading session, the price broke above the upper boundary with another bullish gap (marked by the second arrow).
It is important to note that:
→ The sharp surge in silver prices towards a historic high may have been driven by a shortage of seller liquidity at the opening of financial markets during the final week of the year.
→ The aggressive nature of the subsequent decline towards $75 appears to be a clear sign of a shift in market sentiment.
→ Wide candlesticks indicate heightened activity from so-called “smart money”.
Taking the above into account, we can assume that large long-position holders are actively locking in profits after silver prices have risen by approximately 160% since the beginning of 2025. If this hypothesis proves correct, a break below the lower boundary of the orange ascending channel may follow, potentially leading to further downside movement as early as the first days of 2026.
Start trading commodity CFDs with tight spreads (additional fees may apply). Open your trading account now or learn more about trading commodity CFDs with FXOpen.
This article represents the opinion of the Companies operating under the FXOpen brand only. It is not to be construed as an offer, solicitation, or recommendation with respect to products and services provided by the Companies operating under the FXOpen brand, nor is it to be considered financial advice.
Stay ahead of the market!
Subscribe now to our mailing list and receive the latest market news and insights delivered directly to your inbox.


Latest articles

USD/CAD Rises to a Two-Month High
Today, the USD/CAD currency pair climbed above the 1.3787 level for the first time since late January.
→ Demand for the US dollar is being supported by concerns over escalating tensions in the Middle East. Market participants are favouring

Alphabet (GOOGL) Shares Fall to 2026 Low
As the chart shows, Alphabet (GOOGL) shares have dropped to their lowest level of 2026, with trading closing well below the psychological $300 per share mark.
Why Have Alphabet (GOOGL) Shares Declined?
The bearish move is driven by a combination

FX Market Awaits Macro Data: EUR/USD and GBP/USD Near Range Boundaries
European currencies are trading without a clear direction against the US dollar, remaining in a consolidation phase following the earlier decline driven by USD strength. At the start of the week, both EUR/USD and GBP/USD attempted a recovery,