


Since the Start of the Week, Brent Oil Price Has Dropped over 4%
FXOpen
At the beginning of the week, March 15, we wrote that the price of Brent oil could form a correction from the resistance level of USD 91 per barrel. Since then, the price has decreased by more than 4% due to a number of factors:
→ easing concerns about the escalation of the conflict between Israel and Iran. Iran is the third-largest producer in the Organization of Petroleum Exporting Countries, according to Reuters, and easing its conflict with Israel reduces the likelihood of supply disruptions in the Middle East.
→ reduction in oil consumption. JP Morgan analysts noted this week that global oil consumption in April stood at 101 million barrels per day, 200,000 barrels below forecast.
→ growth in oil reserves in the USA. Crude oil inventories rose 2.7 million barrels last week, the EIA reported.
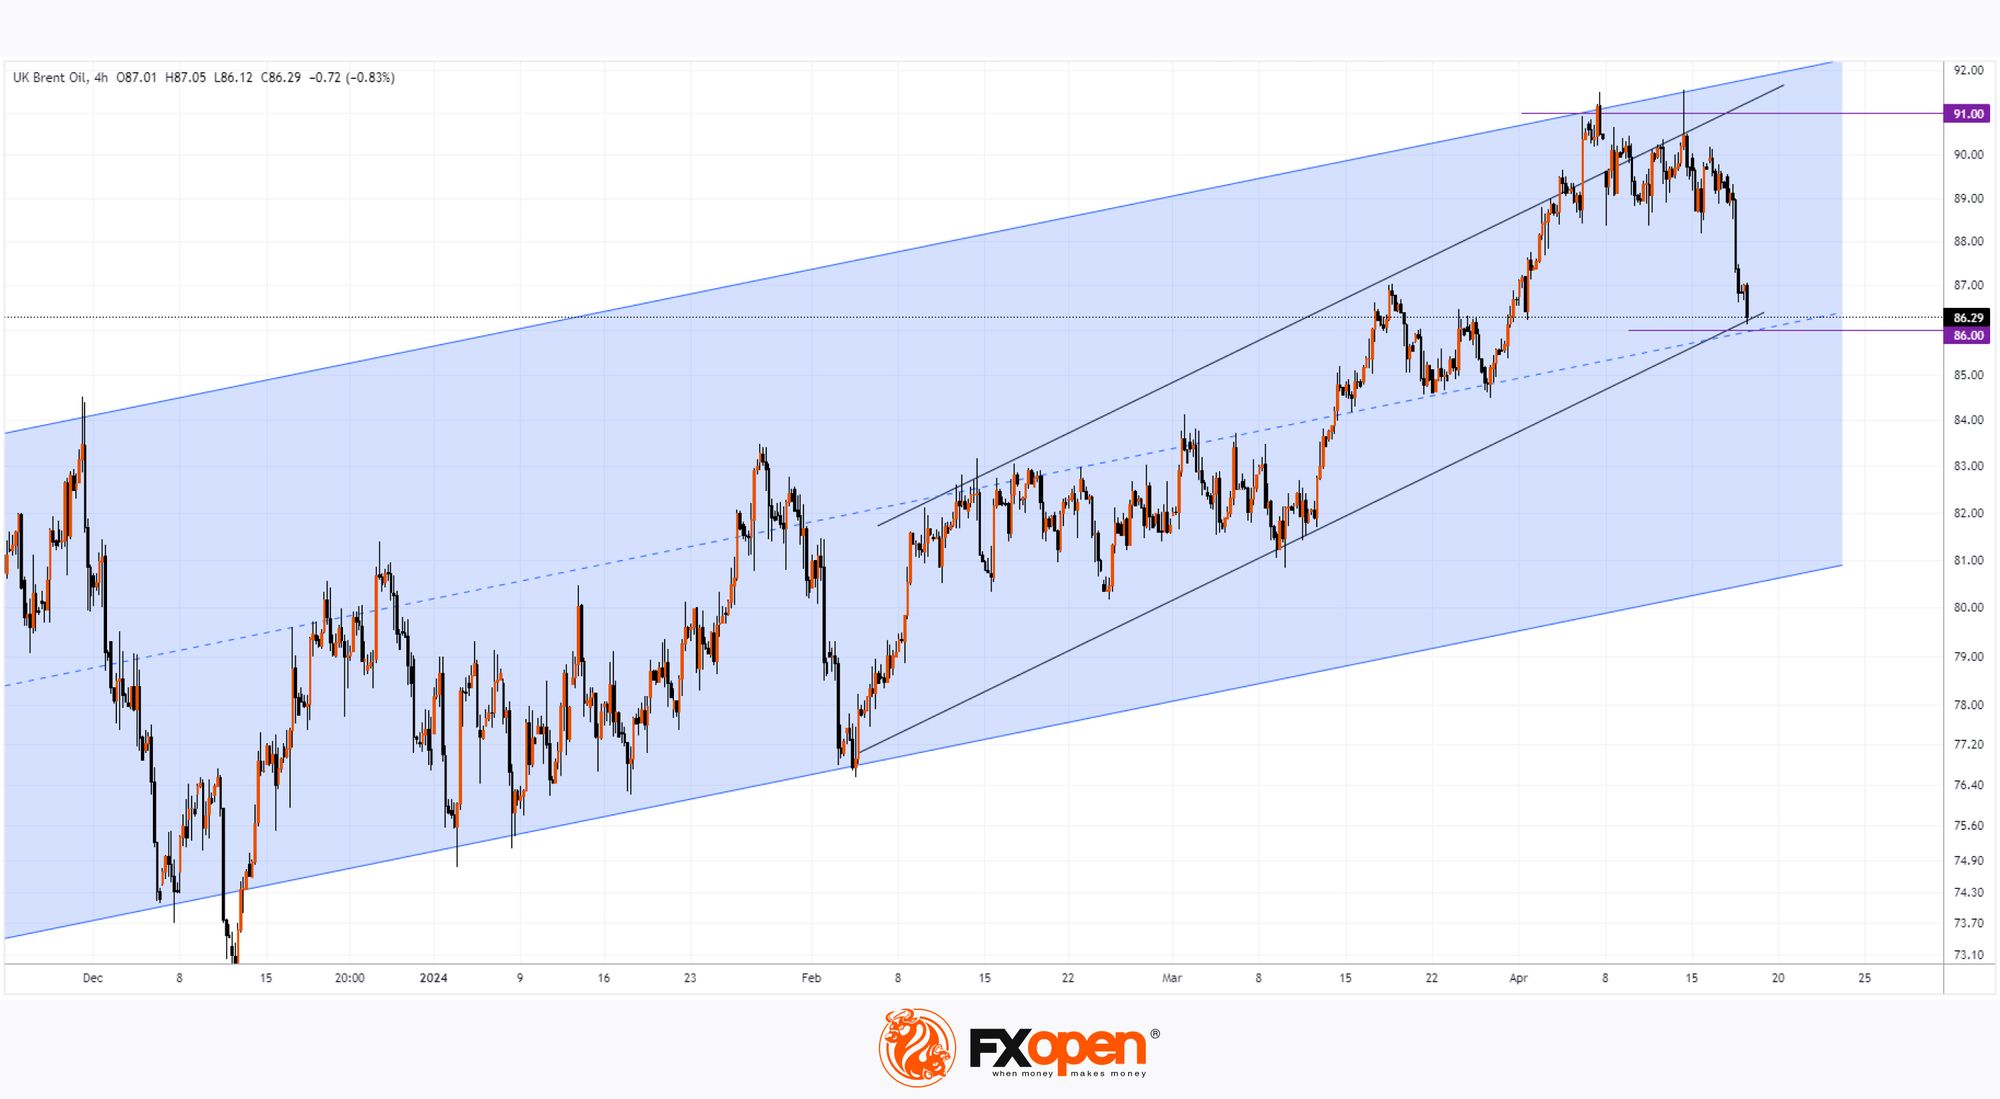
Technical analysis of the Brent oil chart shows that the price has declined to the lower boundary of the intermediate ascending channel (shown by black lines), as expected. This means that the market may experience a rebound from the level of $86, where the support zone is located, which is formed by:
→ median line of the long-term blue channel;
→ lower border of the intermediate black channel.
We note that the development of bearish sentiment will be hampered by the so-called risk premium associated with geopolitical factors.
Start trading commodity CFDs with tight spreads (additional fees may apply). Open your trading account now or learn more about trading commodity CFDs with FXOpen.
This article represents the opinion of the Companies operating under the FXOpen brand only. It is not to be construed as an offer, solicitation, or recommendation with respect to products and services provided by the Companies operating under the FXOpen brand, nor is it to be considered financial advice.
Stay ahead of the market!
Subscribe now to our mailing list and receive the latest market news and insights delivered directly to your inbox.


Latest articles

AI Valuations Are Back in the Spotlight
Artificial intelligence remains the dominant investment theme of 2026, but investors are increasingly questioning whether AI stock valuations are keeping pace with reality.
💰 Big Tech continues to invest at an unprecedented scale, with hyperscaler AI spending projected to exceed $800

AUD/CAD: Months of Indecision — Is a Breakout Finally Coming?
The Australian dollar has clawed back most of its end-of-June losses, when it touched three-month lows against the greenback amid escalating Middle East tensions. Since then, sentiment has improved: the RBA's Assistant Governor Sarah Hunter signalled the board stands ready

USD/JPY: Battling at the Top of the Triangle
On 3 July, Japan's Finance Minister, Satsuki Katayama, stated that the Ministry of Finance remains in close contact with US authorities regarding developments in USD/JPY as the yen traded near its weakest level in almost 40 years. Similar verbal