


The S&P 500 Index Trades Near Its All-Time High
FXOpen

As indicated by the S&P 500 index chart (US SPX 500 mini on FXOpen):
→ After breaking above the resistance line (shown in red) in the third week of December, the equity market formed an upward trend, consistent with the typical characteristics of the Santa Claus Rally.
→ At the opening of trading in the final week of the year, the market is showing downward momentum. The index has slipped towards the 6,920 area, reflecting the sentiment of remaining market participants ahead of key news releases: the FOMC meeting minutes on 30 December and US labour market data on 31 December.
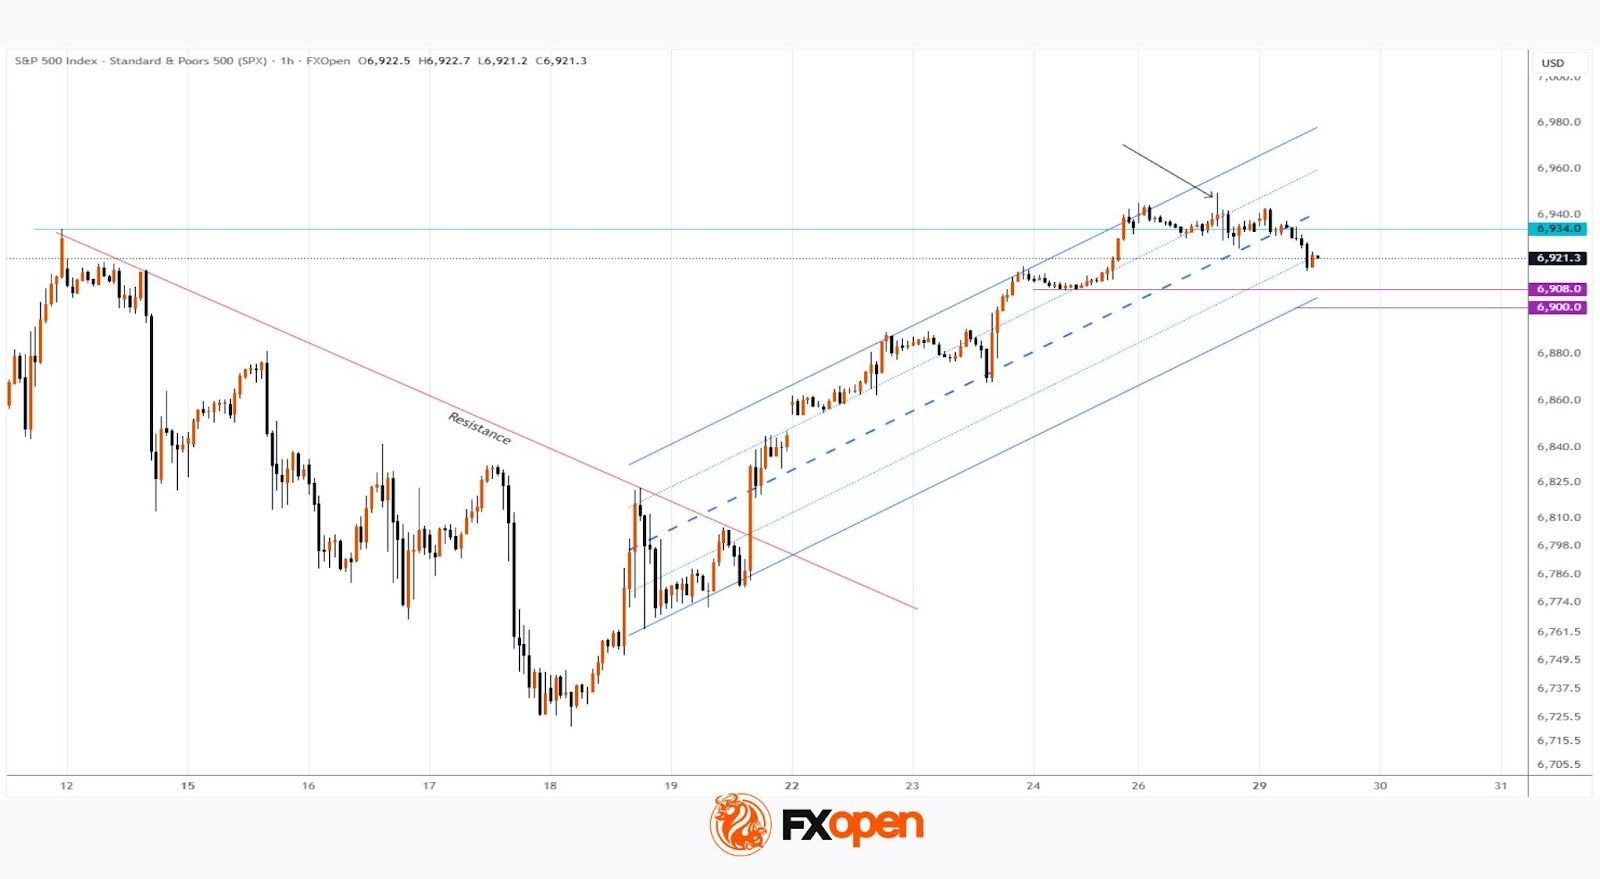
Technical Analysis of the S&P 500 Chart
Price action analysis points to a lack of conviction among bulls. After breaking above the 11 December high near the 6,934 level, further progress was limited, with the price failing to show signs of firm consolidation at record highs.
At the same time, bears became more active, as evidenced by the long upper shadow (marked by the arrow). Their pressure proved effective, resulting in a break below the median line of the ascending channel.
It cannot be ruled out that bearish momentum will continue, pushing the S&P 500 index (US SPX 500 mini on FXOpen) down towards a support zone formed by:
→ the psychological 6,900 level and the 24 December low near 6,907;
→ the lower boundary of the Santa Claus Rally ascending channel.
Trade global index CFDs with zero commission and tight spreads (additional fees may apply). Open your FXOpen account now or learn more about trading index CFDs with FXOpen.
This article represents the opinion of the Companies operating under the FXOpen brand only. It is not to be construed as an offer, solicitation, or recommendation with respect to products and services provided by the Companies operating under the FXOpen brand, nor is it to be considered financial advice.
Stay ahead of the market!
Subscribe now to our mailing list and receive the latest market news and insights delivered directly to your inbox.


Latest articles

EUR/USD: All Eyes on the Fed as the Range Reaches Its Breaking Point
The dollar's next move hinges on tonight's Fed decision, and this time markets genuinely don't know what to expect. While economists still lean toward a hold—with CME FedWatch odds sitting near 68.5% for no change—Kevin Warsh's hawkish

USD/JPY and USD/CAD Test Resistance Ahead of Fresh Fed Signals
The US dollar continues to hold the upper hand against most major currencies ahead of the outcome of the latest Federal Reserve meeting. While the base-case scenario remains for interest rates to stay unchanged, markets are also pricing in the

Amazon Earnings: Does the Chart Already Know Something the Numbers Don't?
All eyes are on July 30, when Amazon reports Q2 2026 earnings, with Wall Street increasingly convinced the bar has been set too low. Consensus sees EPS near $1.82-$2.26 on roughly $197 billion in revenue, but the