


Stock Market Analysis: NVDA Losing Leadership?
FXOpen
Since the start of the week, the S&P-500 Index (US500) is up about 0.58% while NVDA's share price is down about 3.8%. This is a worrying sign for Nvidia stock investors — could it be a sign that NVDA is no longer the market leader?
Dubravko Lakos-Bujas, JPMorgan's chief equity strategist, warned of a potential "surprise" shock to the stock market, Bloomberg reported. He's noticed a trend in recent history where gains in popular momentum stocks like NVDA are often followed by corrections. This situation has repeated itself three times since the 2008 global financial crisis.
“One day this may happen completely unexpectedly. This has happened in the past; we’ve had flash collapses,” Lakos-Bujas said in the webinar. “One large fund starts cutting some positions, a second fund hears this and tries to reposition, a third fund is basically caught off guard, and then, you know, we start to unwind more and more momentum.”
He noted the potential for innovation in artificial intelligence as a major source of surprise, emphasizing that these opportunities are dwindling and risks are growing in the background.
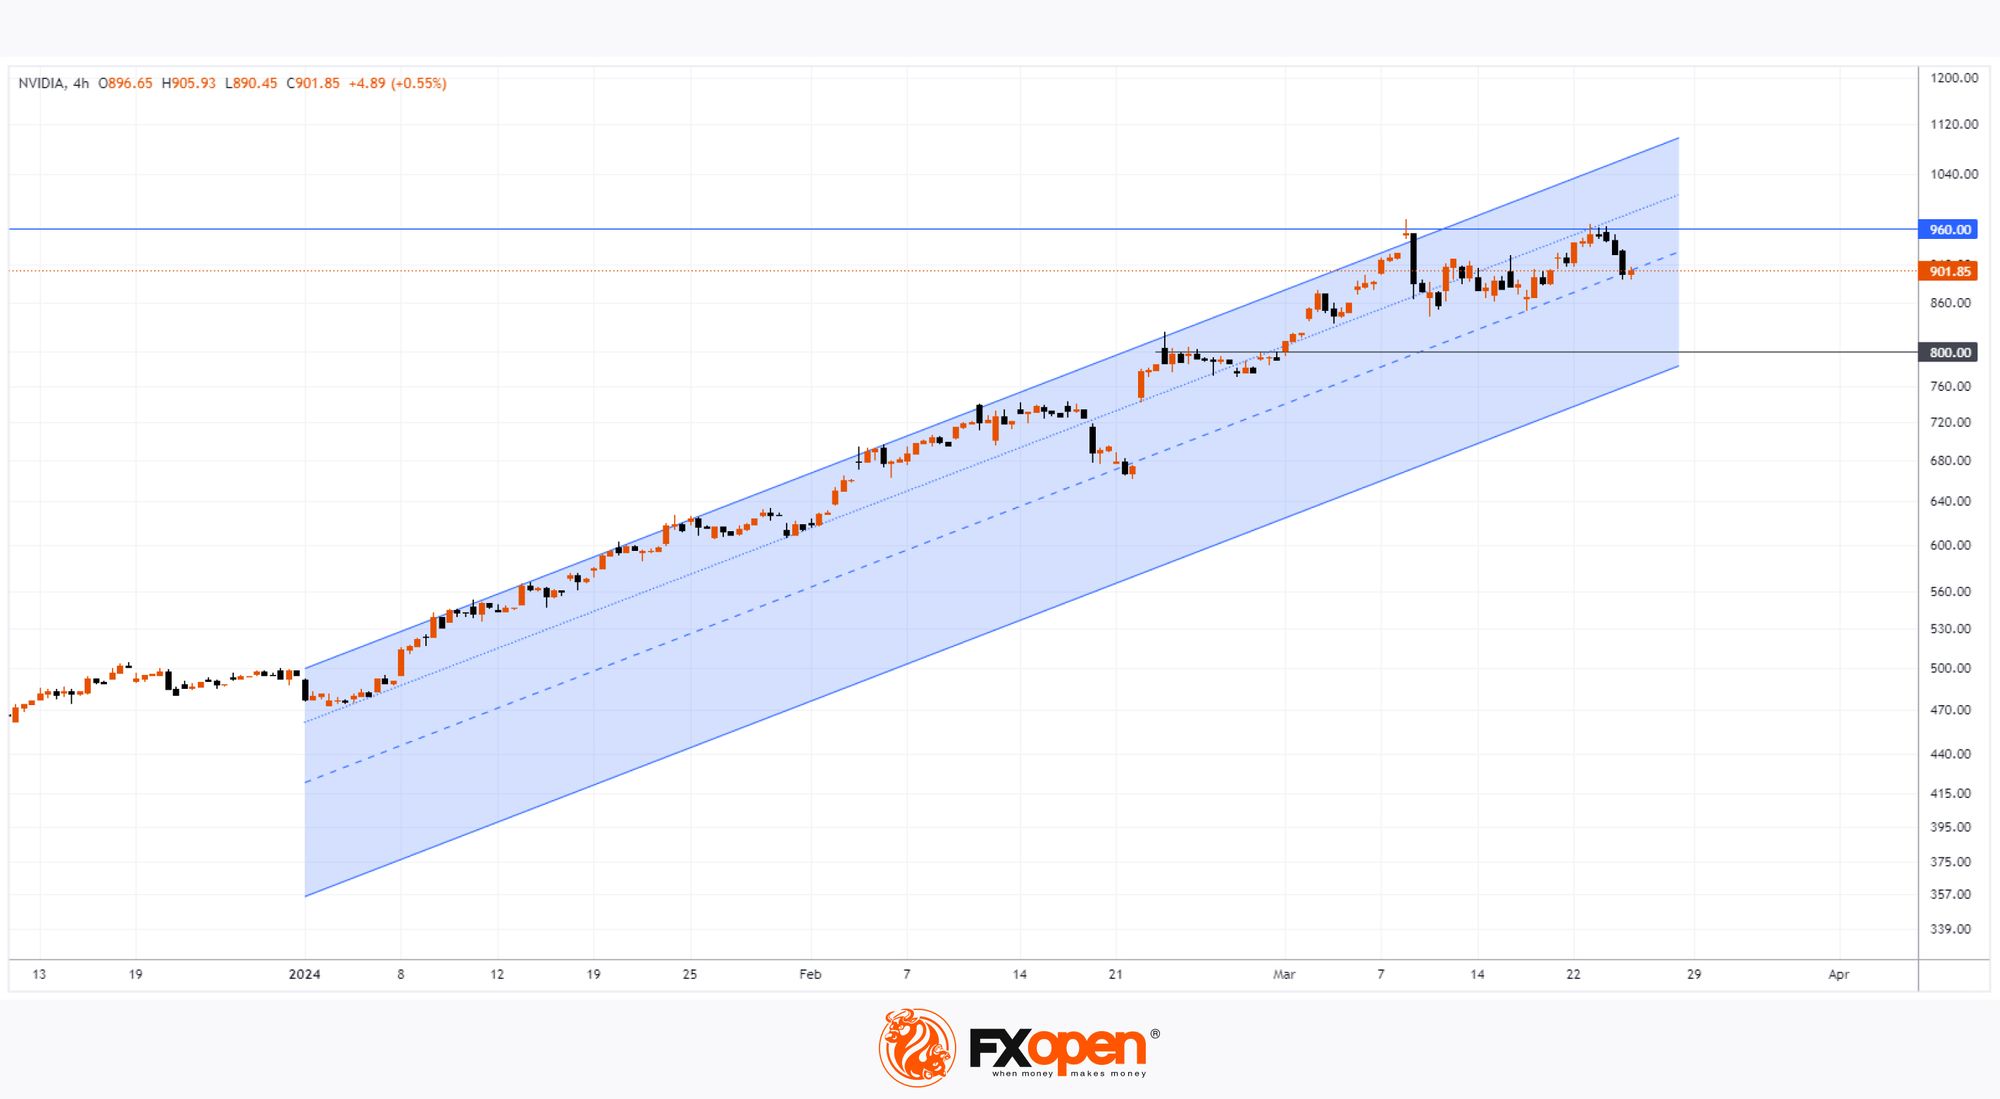
Technical analysis of NVDA shares shows that:
→ so far the price is in an upward trend - its contours are shown by the blue channel;
→ yesterday’s close lowered the price to its median line;
→ the $960 level looks like an important resistance.
The all-time high is approximately 100% of NVDA's share price at the start of the year - the price has doubled in less than 3 months, so a correction appears natural in this extremely hot market. It is possible that the price of NVDA may roll back to the lower border of the channel and test the psychological level of $800 per share.
Buy and sell stocks of the world's biggest publicly-listed companies with CFDs on FXOpen’s trading platform. Open your FXOpen account now or learn more about trading share CFDs with FXOpen.
This article represents the opinion of the Companies operating under the FXOpen brand only. It is not to be construed as an offer, solicitation, or recommendation with respect to products and services provided by the Companies operating under the FXOpen brand, nor is it to be considered financial advice.
Stay ahead of the market!
Subscribe now to our mailing list and receive the latest market news and insights delivered directly to your inbox.


Latest articles

GBP/CHF: Trendline or RSI — Which One Is Lying?
Sterling enters this week on firmer footing, with political uncertainty fading fast after Andy Burnham's confirmation as Labour leader eased investor concerns over the succession to Keir Starmer. Markets reacted further to reports pointing to Shabana Mahmood as the frontrunner

Silver Attempts to Break Out of Its Range
Silver continues to balance between its dual role as an industrial metal and so-called refuge asset, and this combination largely explains the lack of a clear trend in recent weeks. Shifting expectations for central bank interest rates can influence the

Nasdaq 100: Is This the Correction Traders Have Been Waiting For?
The Nasdaq 100 (US Tech 100 Mini on FXOpen) remains caught between two opposing forces: cooling inflation on one side, and persistent geopolitical instability on the other. On 14 July, June's CPI print came in softer than expected, easing near-term