


Strategy (MSTR) Shows Signs of Hope After Dramatic Drop
FXOpen

The share price of Strategy Incorporated (MSTR), led by Michael Saylor, a well-known Bitcoin advocate, has plunged catastrophically, losing over 65% from its July highs.
While Bitcoin itself has declined by only around 30–35% from its autumn peaks, MSTR shares fell roughly twice as much. This may be linked to Saylor’s strategy of heavily buying Bitcoin on borrowed funds – a tactic that amplified gains when crypto prices rose but intensified losses as BTC/USD fell, placing extra pressure on the company’s market capitalisation and creating risks for MSTR shareholders.
Reports indicate that major funds, including BlackRock, Vanguard, and Fidelity, sold significant holdings of MSTR shares in Q3, and JPMorgan has warned that MSTR could be removed from the Nasdaq 100.
Yesterday, the price dropped to its lowest level since last autumn. However, the chart offers tentative hope for bulls. The candle is notable because, although the price fell below $160, it closed above $170, showing that the decline did not fully continue.
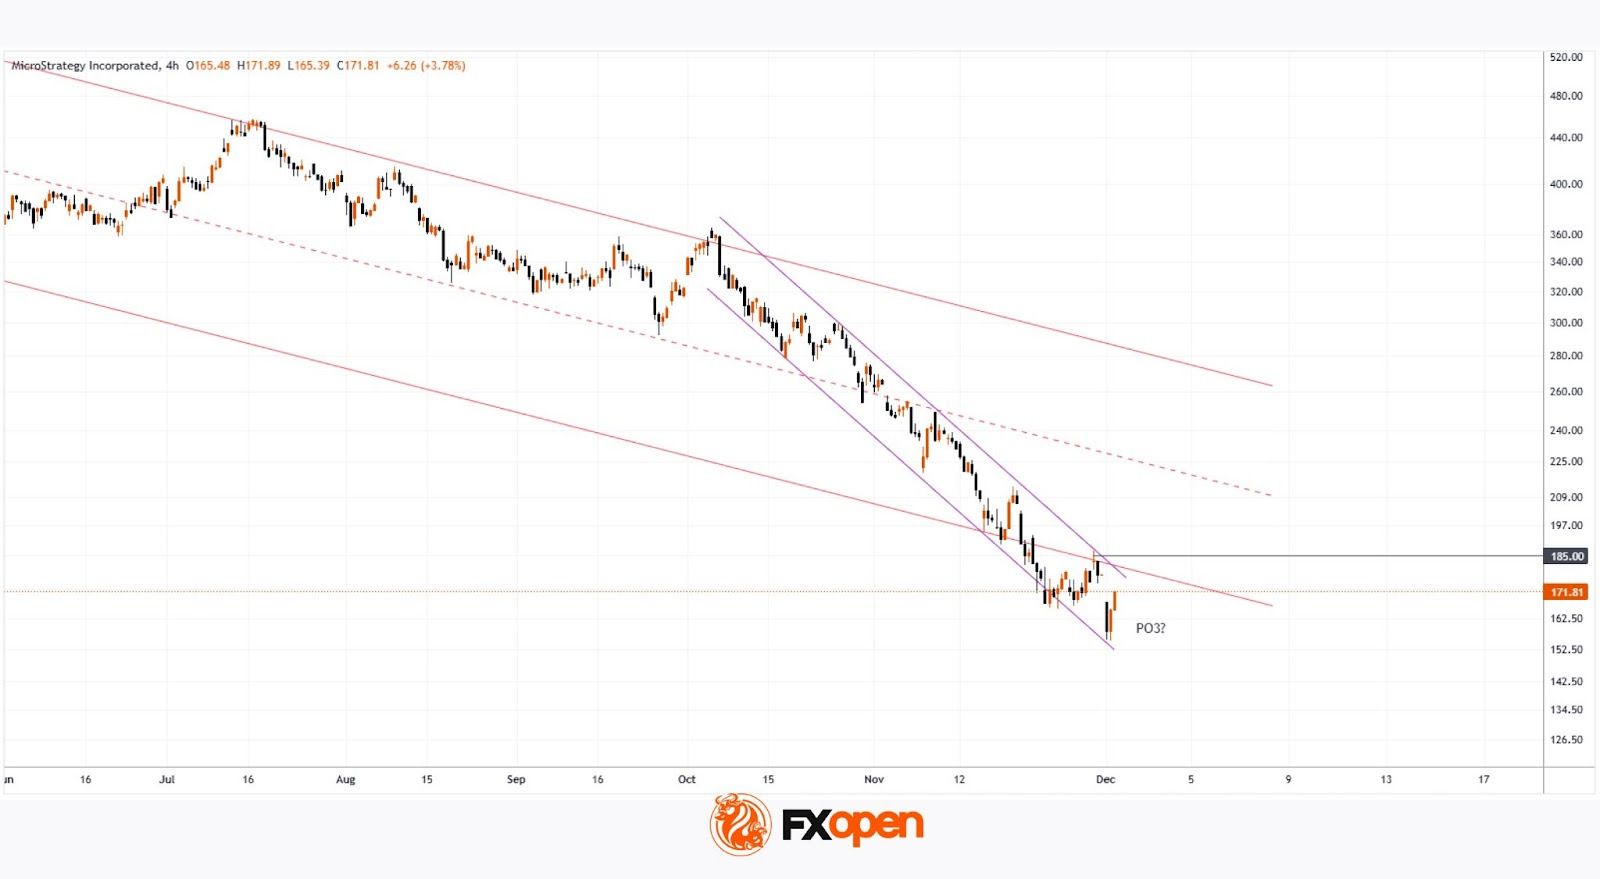
From the perspective of the Smart Money Concept, there are early signs of a bullish PO3 pattern if we interpret:
→ late-November price fluctuations as the Accumulation phase;
→ yesterday’s candle as a Manipulation move.
If this pattern plays out, it could lead to a Distribution phase, creating potential for a price recovery. A bullish breakout above the $185 resistance could open the way to a broader rebound, for example, towards the median of the red channel. The realisation of this optimistic scenario, however, largely depends on the price of Bitcoin, of which Strategy holds approximately 650,000 coins.
Buy and sell stocks of the world's biggest publicly-listed companies with CFDs on FXOpen’s trading platform. Open your FXOpen account now or learn more about trading share CFDs with FXOpen.
This article represents the opinion of the Companies operating under the FXOpen brand only. It is not to be construed as an offer, solicitation, or recommendation with respect to products and services provided by the Companies operating under the FXOpen brand, nor is it to be considered financial advice.
Stay ahead of the market!
Subscribe now to our mailing list and receive the latest market news and insights delivered directly to your inbox.


Latest articles


Market Repricing of Risk as Gold Loses Safe-Haven Demand
Geopolitical tensions in the Middle East had remained the primary macro driver for the gold market over recent weeks; however, on 8 April the situation shifted sharply as the United States and Iran agreed to a temporary two-week ceasefire, including

Commodity Currencies on the Rise: Market Focus Shifts to US and Canadian Data
Commodity-linked currencies continue to strengthen, while the US dollar remains under pressure amid easing geopolitical tensions and a shift in investor preference towards riskier assets. Reports of a temporary ceasefire between the US and Iran have helped stabilise sentiment and