


FXOpen

President Joe Biden withdrew his bid for a second term in the White House on Sunday. It's reasonable to assume that the stock market responded optimistically to this news, as US stocks closed higher on Monday, with the S&P 500 (US SPX 500 mini on FXOpen) rising by 1.08% to 5,564.41 – its best day since 5th June. CNN Money's Fear and Greed Index showed an improvement in overall market sentiment, moving into the "Greed" zone.
TSLA stocks showed even more positive momentum, gaining 5.15% yesterday.
Recall that on 2nd July we noted that the TSLA price:
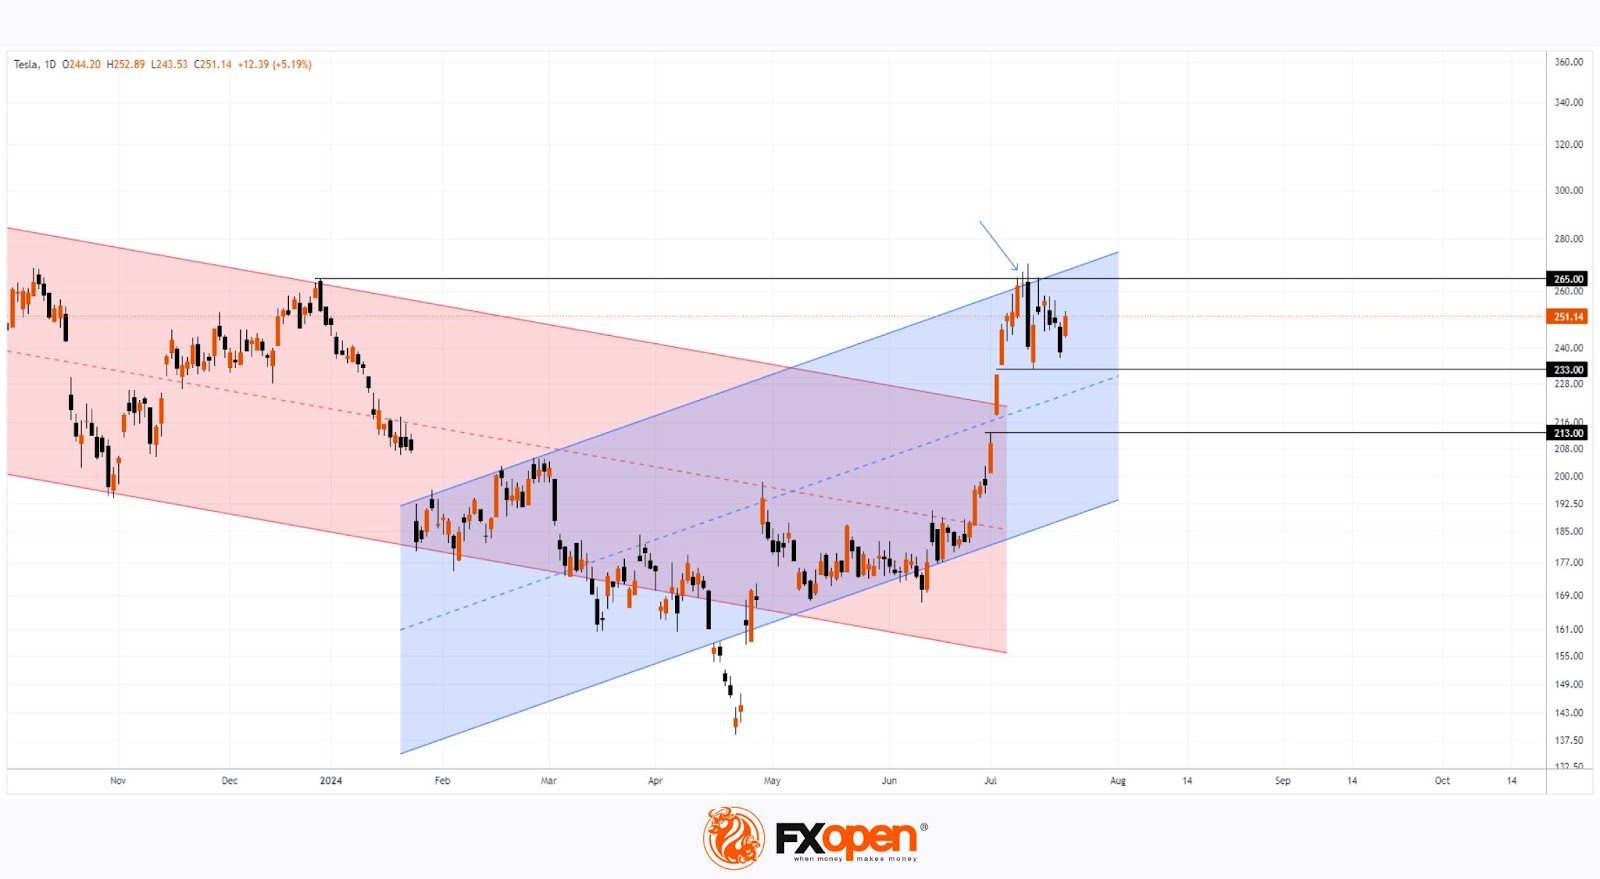
→ Was still within a descending channel (shown in red);
→ But was showing strong momentum, having crossed the median of the red channel and forming an ascending channel (shown in blue).
Since then, the TSLA price has:
→ Surpassed the upper boundary of the descending channel, breaking out of the downward trend it had been in since late 2021;
→ Continued to form a bullish channel, reaching its upper boundary last week.
Can TSLA Maintain Its Recent Highs?
Bearish arguments:
→ The upper boundary of the blue channel acts as resistance;
→ The December 2023 peak around $265 could serve as resistance;
→ Long upper shadows (indicated by arrows) suggest bearish activity around this level.
Bullish argument:
→ The strong rise when breaking through the red channel. On 2-3 July, the price formed two bullish gaps, creating a wide range of $213-233. This range could serve as significant support in the future.
However, the decisive factor could be Tesla's Q2 corporate report (expected to be published today after the close of the main session).
Buy and sell stocks of the world's biggest publicly-listed companies with CFDs on FXOpen’s trading platform. Open your FXOpen account now or learn more about trading share CFDs with FXOpen.
This article represents the opinion of the Companies operating under the FXOpen brand only. It is not to be construed as an offer, solicitation, or recommendation with respect to products and services provided by the Companies operating under the FXOpen brand, nor is it to be considered financial advice.
Stay ahead of the market!
Subscribe now to our mailing list and receive the latest market news and insights delivered directly to your inbox.


Latest articles

Market Analysis: GBP/USD Dips Further As EUR/GBP Regains Traction
GBP/USD failed to climb above 1.3500 and corrected some gains. EUR/GBP started a decent increase and might aim for more gains above 0.8700.
Important Takeaways for GBP/USD and EUR/GBP Analysis Today
· The British Pound


Market Insights with Gary Thomson: Oil, US Retail Sales & NFP in Focus
In this video, we’ll explore the key economic events and market trends, shaping the financial landscape. Get ready for insights into financial markets to help you navigate the week ahead. Let’s dive in!
In this episode of Market