


FXOpen

On 10 October, at the Warner Brothers studio in Burbank, California, Elon Musk unveiled three products during the presentation of “We, Robot”:
→ Cybercab – an autonomous robotaxi that Musk claims will be produced in very large quantities.
→ Robovan – an autonomous bus capable of transporting 20 people or cargo, with an expected price tag of under $30,000.
→ Optimus Gen 2 – humanoid robots that participated in the event, with Musk showcasing a video of how Optimus can be used in home settings.
Elon Musk stated that Tesla anticipates the arrival of fully autonomous vehicles without supervision in Texas and California by next year.
Despite the revolutionary nature of the products presented under the Tesla brand, investors seem disappointed, as TSLA shares are trading around $225 in pre-market today, down from over $238 at yesterday's close.
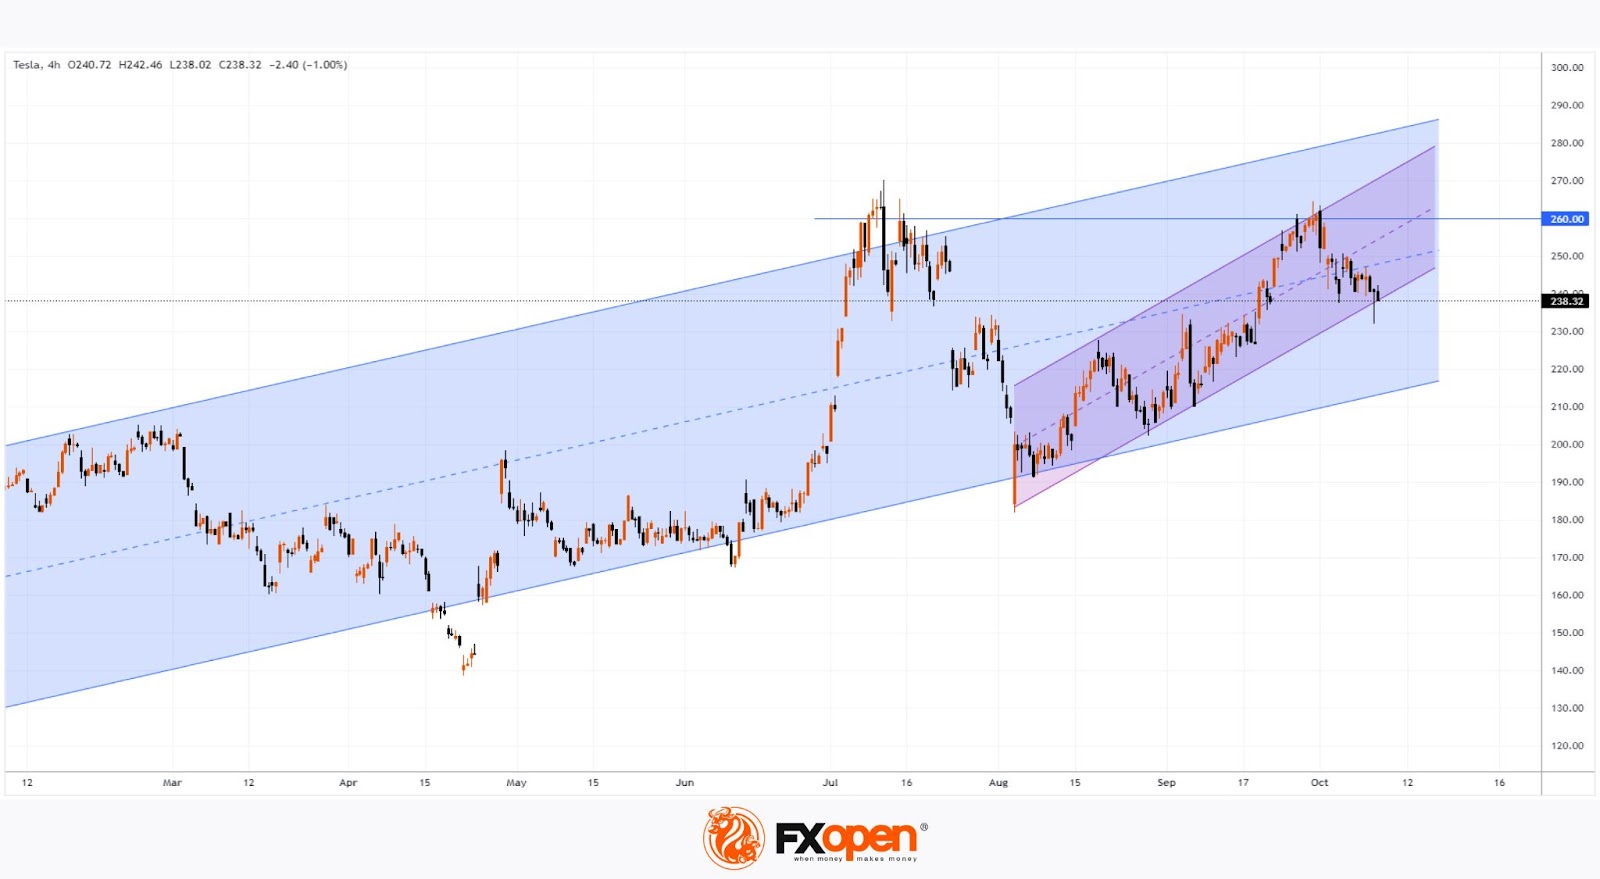
Technical analysis of the Tesla (TSLA) stock chart indicates that the ascending channel (marked in purple), which has guided the price upward since August, may break downward at the market open today.
From a broader perspective, TSLA shares are within a wide ascending channel (shown in blue) – the bearish momentum following the “We, Robot” event could potentially push the price down to the lower boundary, further distancing it from resistance at the $260 level.
Investors may reevaluate their initial reactions to the unveiled Cybercab, Robovan, and Optimus. Nonetheless, the current decline in TSLA's stock price serves as a warning ahead of the earnings report scheduled for 23 October.
Buy and sell stocks of the world's biggest publicly-listed companies with CFDs on FXOpen’s trading platform. Open your FXOpen account now or learn more about trading share CFDs with FXOpen.
This article represents the opinion of the Companies operating under the FXOpen brand only. It is not to be construed as an offer, solicitation, or recommendation with respect to products and services provided by the Companies operating under the FXOpen brand, nor is it to be considered financial advice.
Stay ahead of the market!
Subscribe now to our mailing list and receive the latest market news and insights delivered directly to your inbox.


Latest articles

Market Analysis: GBP/USD Dips Further As EUR/GBP Regains Traction
GBP/USD failed to climb above 1.3500 and corrected some gains. EUR/GBP started a decent increase and might aim for more gains above 0.8700.
Important Takeaways for GBP/USD and EUR/GBP Analysis Today
· The British Pound


Market Insights with Gary Thomson: Oil, US Retail Sales & NFP in Focus
In this video, we’ll explore the key economic events and market trends, shaping the financial landscape. Get ready for insights into financial markets to help you navigate the week ahead. Let’s dive in!
In this episode of Market