


FXOpen

Analysing Tesla (TSLA) stock chart on 12th December, we:
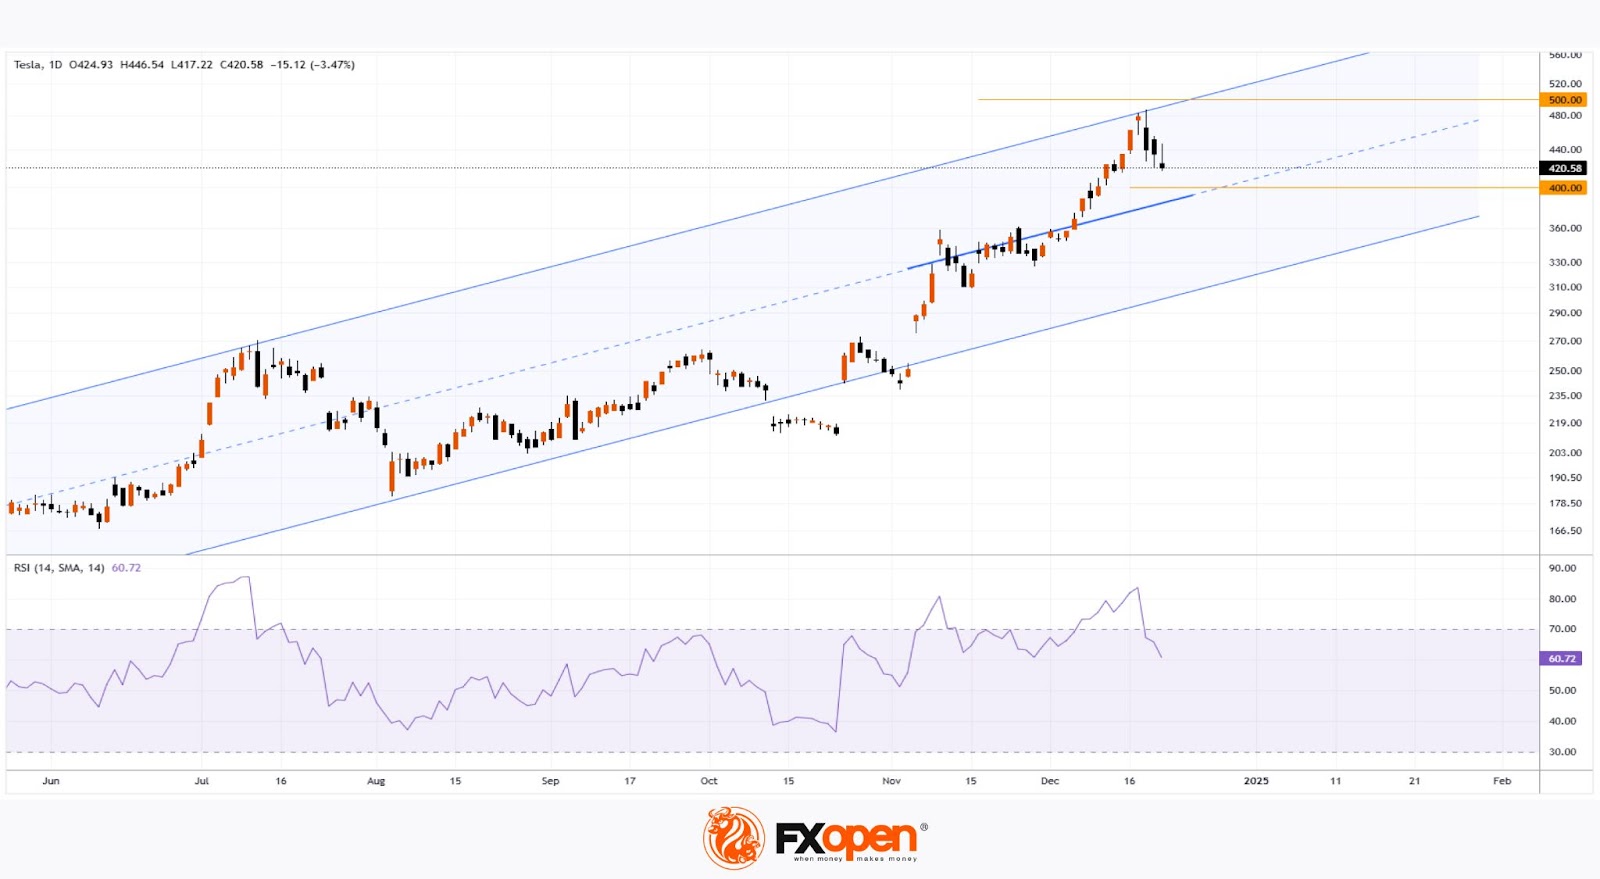
→ Identified an ascending channel, with the November price consolidation around $350 (marked by a thick blue line) potentially indicating the median line of the long-term ascending channel (highlighted in blue).
→ Mentioned that TSLA stock price could move toward the upper boundary of the channel, located near the psychological level of $500. However, the stock remained vulnerable to a pullback with a potential test of the $400 level.
What happened after our analysis?
According to Tesla (TSLA) stock chart:
→ The price bounced off the upper boundary of the channel, falling short of the psychological $500 level by approximately 2.5%.
→ On Friday, TSLA stock dropped by more than 3%, making it the worst-performing stock within the S&P 500 index (US SPX 500 mini on FXOpen).
This indicates that buyer momentum may have waned, leading to a correction from overbought levels (as indicated by the RSI) toward fair value, which could align with the channel’s median line. A test of the $400 level could be relevant.
Meanwhile, Wall Street analysts are pessimistic. According to TipRanks:
→ Only 13 out of 34 surveyed analysts recommend buying TSLA stock.
→ The average price target for TSLA is $293.76 by the end of 2025.
Read detailed Analytical Tesla (TSLA) stock price forecasts for 2025–2030.
Buy and sell stocks of the world's biggest publicly-listed companies with CFDs on FXOpen’s trading platform. Open your FXOpen account now or learn more about trading share CFDs with FXOpen.
This article represents the opinion of the Companies operating under the FXOpen brand only. It is not to be construed as an offer, solicitation, or recommendation with respect to products and services provided by the Companies operating under the FXOpen brand, nor is it to be considered financial advice.
Stay ahead of the market!
Subscribe now to our mailing list and receive the latest market news and insights delivered directly to your inbox.


Latest articles

Market Analysis: GBP/USD Dips Further As EUR/GBP Regains Traction
GBP/USD failed to climb above 1.3500 and corrected some gains. EUR/GBP started a decent increase and might aim for more gains above 0.8700.
Important Takeaways for GBP/USD and EUR/GBP Analysis Today
· The British Pound


Market Insights with Gary Thomson: Oil, US Retail Sales & NFP in Focus
In this video, we’ll explore the key economic events and market trends, shaping the financial landscape. Get ready for insights into financial markets to help you navigate the week ahead. Let’s dive in!
In this episode of Market