


FXOpen

The second half of February has seen the dollar index strengthen, driven by a combination of bullish factors:
→ A hawkish Fed stance. Minutes from the latest FOMC meeting revealed differing views on rate cuts. With inflation remaining resilient, some members even left the door open to further tightening.
→ Rising tensions between the US and Iran, along with uncertainty surrounding trade tariffs, have boosted demand for the dollar as a safe-haven asset.
→ Recent data pointing to solid industrial output and labour market resilience have reinforced confidence in the strength of the US economy.
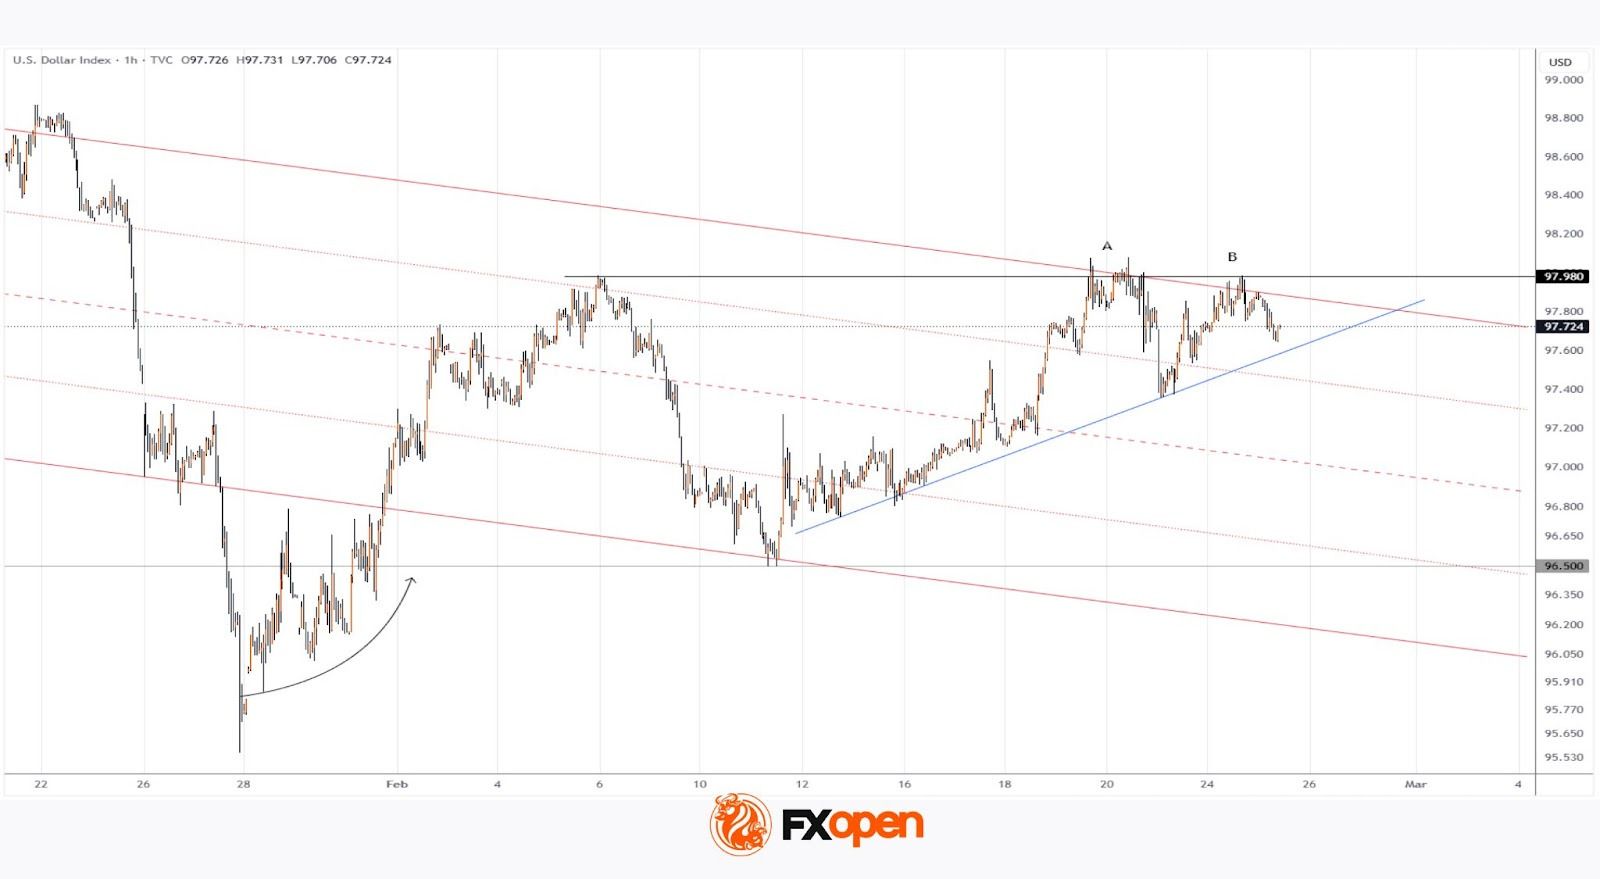
As a result, an upward trend line (shown in blue) has formed on the DXY chart, increasing the likelihood that the index will finish February in positive territory after three consecutive months of decline.
Technical Analysis of the DXY Chart
On 16 February, when analysing the dollar index (DXY), we:
→ Updated the descending channel (marked in red), originating in November 2025.
→ Highlighted strong demand, reflected in the confident upward trajectory (shown by the arrow) following the brief break below the multi-month low of 96.50 in late January.
Lower highs at points A and B suggest that the upper boundary of the channel continues to act as resistance, while the hesitant price action after breaking the 5 February high indicates waning bullish momentum. This raises the possibility that the blue uptrend line could soon come under pressure from renewed bearish attempts.
On the other hand, there are clear signs of active demand near the key 96.50 level. Therefore, in the longer term, bulls may regain strength and attempt to overturn the broader downtrend.
Trade global index CFDs with zero commission and tight spreads (additional fees may apply). Open your FXOpen account now or learn more about trading index CFDs with FXOpen.
This article represents the opinion of the Companies operating under the FXOpen brand only. It is not to be construed as an offer, solicitation, or recommendation with respect to products and services provided by the Companies operating under the FXOpen brand, nor is it to be considered financial advice.
Stay ahead of the market!
Subscribe now to our mailing list and receive the latest market news and insights delivered directly to your inbox.


Latest articles

Market Analysis: Gold Price Slips Back, WTI Crude Oil Rally Gains Fresh Strength
Gold price rallied above $4,750 before correcting lower. Crude oil prices are rising and could climb further higher toward $110.00.
Important Takeaways for Gold and WTI Crude Oil Prices Analysis Today
· Gold price gained pace for a move

Consolidation Ahead of NFP: Commodity Currencies Search for Direction
Commodity-linked currencies have entered a consolidation phase following recent directional moves, as market participants adopt a wait-and-see approach ahead of key US labour market data. Current price action reflects a balance between ongoing demand for the US dollar and attempts

The Real Driver Behind the Dollar Rally: Market Insights with Gary Thomson
The US dollar has been firm, but the drivers behind the move may be more complex than they first appear.
While geopolitical tension and shifts in risk sentiment play a role, current price behaviour seems increasingly influenced by inflation expectations