


FXOpen

The key event of the week will take place on 10 December – at 22:00 GMT+3 the FOMC will publish its interest rate decision, followed half an hour later by a press conference with Jerome Powell.
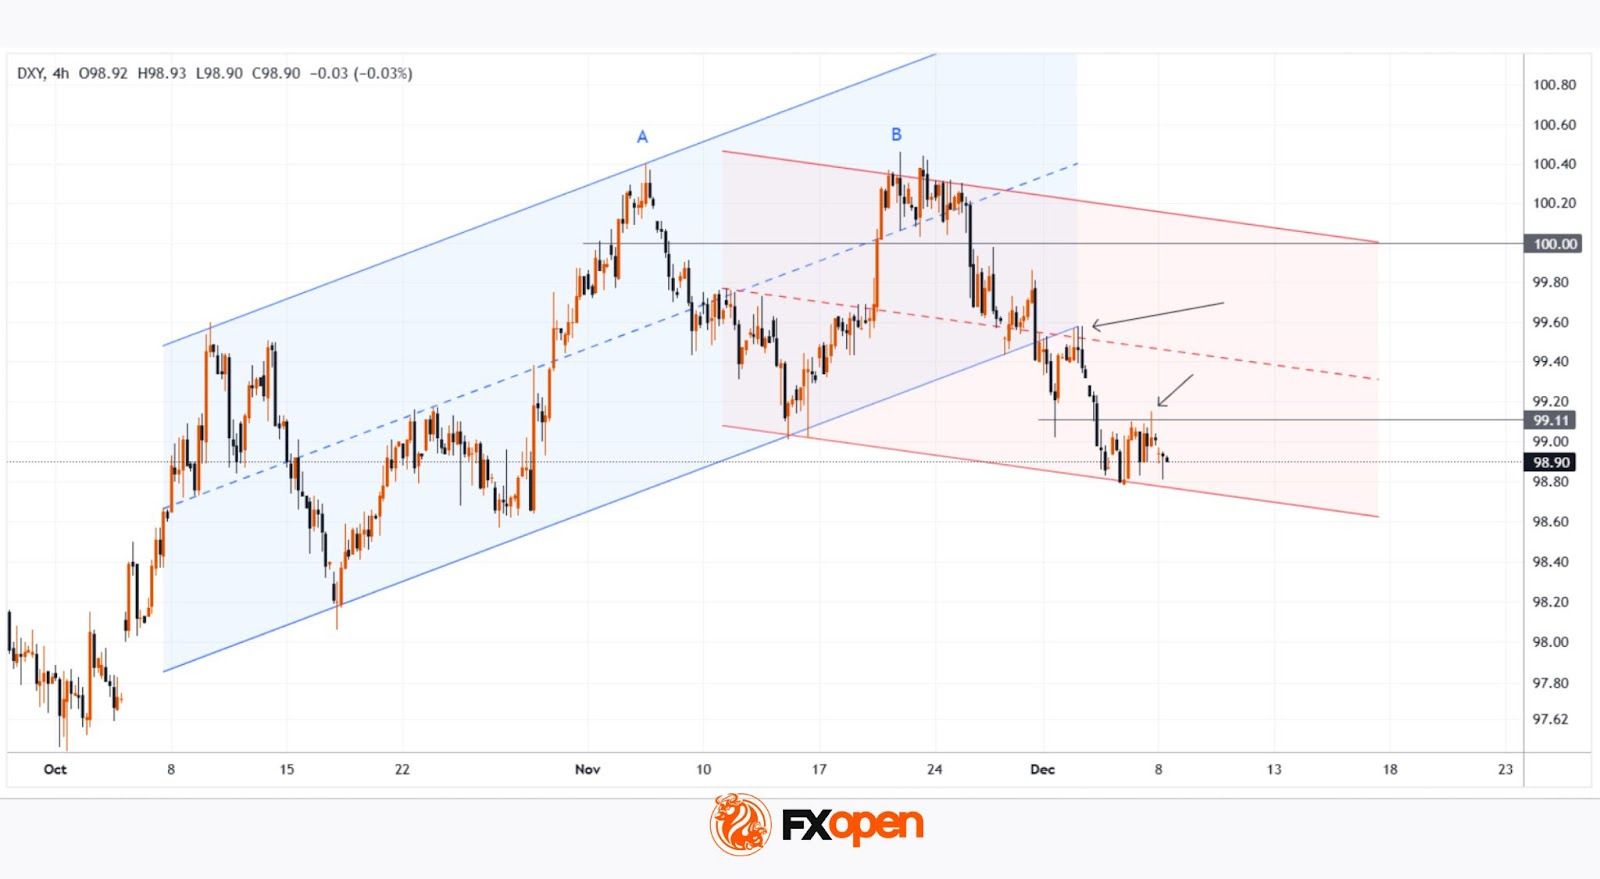
As the chart of the dollar index (DXY) shows, the US dollar is weakening as the event approaches, reflecting market sentiment – the rate is expected to be cut by 25 basis points due to pressure from Trump and a cooling labour market. This underpins the bearish trend that has been in place since late November.
A reminder that on 24 November we:
→ highlighted the importance of resistance around 100.20 points;
→ and constructed a system of two trend channels.
Since then, the price has moved lower within the descending channel, and:
→ new swing points have allowed us to refine the channel boundaries;
→ a large bearish double-top pattern (A–B) has formed on the chart above the psychological level of 100 points.
The dollar index chart indicates that selling pressure is dominant (as shown by the arrows):
→ the lower boundary of the ascending channel has switched its role from support to resistance;
→ a similar role reversal has occurred at the 99.11 level.
Today, the DXY index is near the lower boundary of the descending channel. It is reasonable to assume that in the short term:
→ the market will enter a wait-and-see mode ahead of the news;
→ a consolidation zone may form on the chart, supported by the lower boundary of the red channel.
Be prepared for surges in volatility on the currency markets on Wednesday evening.
Trade global index CFDs with zero commission and tight spreads (additional fees may apply). Open your FXOpen account now or learn more about trading index CFDs with FXOpen.
This article represents the opinion of the Companies operating under the FXOpen brand only. It is not to be construed as an offer, solicitation, or recommendation with respect to products and services provided by the Companies operating under the FXOpen brand, nor is it to be considered financial advice.
Stay ahead of the market!
Subscribe now to our mailing list and receive the latest market news and insights delivered directly to your inbox.


Latest articles

Consolidation Ahead of NFP: Commodity Currencies Search for Direction
Commodity-linked currencies have entered a consolidation phase following recent directional moves, as market participants adopt a wait-and-see approach ahead of key US labour market data. Current price action reflects a balance between ongoing demand for the US dollar and attempts

The Real Driver Behind the Dollar Rally: Market Insights with Gary Thomson
The US dollar has been firm, but the drivers behind the move may be more complex than they first appear.
While geopolitical tension and shifts in risk sentiment play a role, current price behaviour seems increasingly influenced by inflation expectations

EUR/USD and USD/CHF Pull Back: Market Reacts to Fundamentals
European currencies have shown a recovery in recent trading sessions after their recent decline, displaying early signs of a reversal. The US dollar is weakening amid expectations surrounding upcoming US macroeconomic data, while market participants are reassessing their short-term positions