


FXOpen

Yesterday, Consumer Price Index (CPI) values were published, indicating a slowdown in the rate of inflation in the USA. According to ForexFactory:
→ CPI month-on-month: actual = -0.1%, forecast = 0.1%, previous month = 0.0%;
→ CPI year-on-year: actual = 3.0%, forecast = 3.1%, previous month = 3.3%.
The data confirming the slowdown in inflation raised expectations that the Federal Reserve might lower interest rates as early as September. But why did the Nasdaq 100 (US Tech 100 mini on FXOpen) drop then? Yesterday, the tech stock index fell by over 2.1%, marking its worst day since early May.
The reason lies in rotation. Investors seem to have shifted their focus from the highly inflated tech stocks since the start of 2024 to other sectors. Approximately 400 companies in the S&P 500 index (US SPX 500 mini on FXOpen) showed growth. Meanwhile, the Dow Jones Industrial Average (Wall Street 30 mini on FXOpen) closed in the green yesterday.
Bloomberg reports that Kelly Cox from Ritholtz Wealth Management believes this day could be a turning point for the markets. It also serves as a good reminder of the importance of diversification.
One of the drivers of yesterday's decline was NVDA shares, which fell by more than 5% in a day (we wrote about the bearish behaviour of Nvidia’s price and volumes just the day before).
What’s next?
The equal-weighted version of the S&P 500, where stocks like Nvidia have the same weight as Dollar Tree Inc., rose yesterday. This version of the index is less sensitive to the influence of large tech companies, making a case for the rally expanding to other stocks.
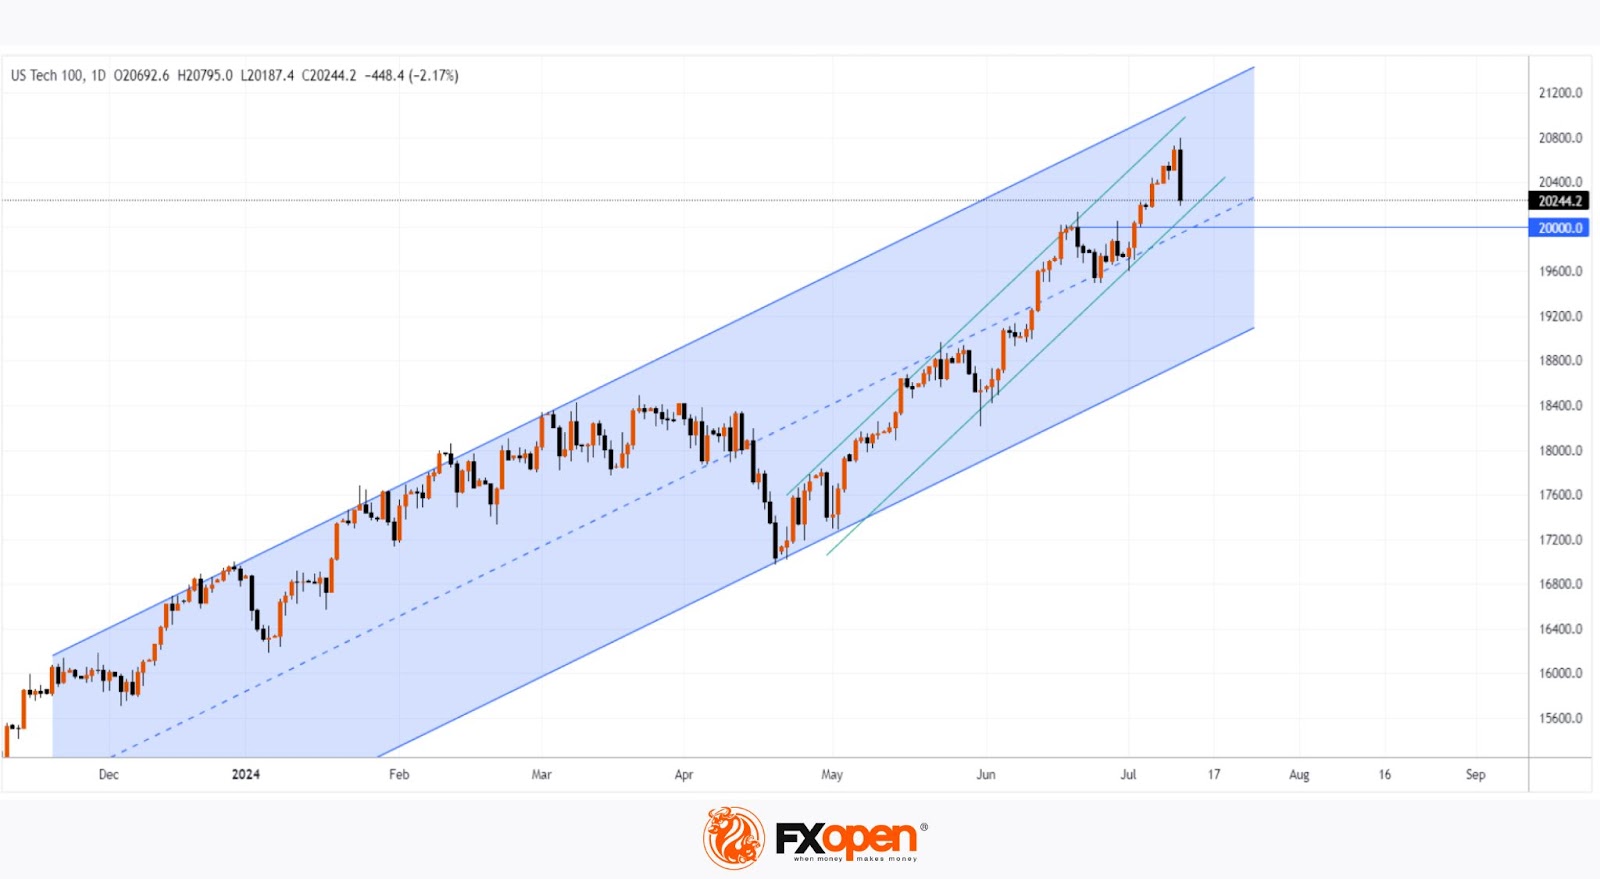
Technical analysis of the Nasdaq 100 (US Tech 100 mini on FXOpen) chart gives bulls some hope, as if the price continues to fall, it will encounter a series of supports:
→ from the lower boundary of the green channel;
→ from the psychological level of 20,000;
→ from the median line of the blue channel.
It is possible that the bearish momentum seen yesterday may dissipate when it meets these supports. However, it is unlikely to restore the attractiveness of tech stocks to the level they had before yesterday.
Trade global index CFDs with zero commission and tight spreads (additional fees may apply). Open your FXOpen account now or learn more about trading index CFDs with FXOpen.
This article represents the opinion of the Companies operating under the FXOpen brand only. It is not to be construed as an offer, solicitation, or recommendation with respect to products and services provided by the Companies operating under the FXOpen brand, nor is it to be considered financial advice.
Stay ahead of the market!
Subscribe now to our mailing list and receive the latest market news and insights delivered directly to your inbox.


Latest articles

Consolidation Ahead of NFP: Commodity Currencies Search for Direction
Commodity-linked currencies have entered a consolidation phase following recent directional moves, as market participants adopt a wait-and-see approach ahead of key US labour market data. Current price action reflects a balance between ongoing demand for the US dollar and attempts

The Real Driver Behind the Dollar Rally: Market Insights with Gary Thomson
The US dollar has been firm, but the drivers behind the move may be more complex than they first appear.
While geopolitical tension and shifts in risk sentiment play a role, current price behaviour seems increasingly influenced by inflation expectations

EUR/USD and USD/CHF Pull Back: Market Reacts to Fundamentals
European currencies have shown a recovery in recent trading sessions after their recent decline, displaying early signs of a reversal. The US dollar is weakening amid expectations surrounding upcoming US macroeconomic data, while market participants are reassessing their short-term positions