


FXOpen
As shown in the daily chart for Netflix (NFLX), during yesterday’s trading session, the price exceeded $725, marking a new all-time high.
The bullish sentiment is driven by the upcoming release of the third-quarter earnings report, scheduled for 17 October. According to Zacks analysts' forecasts: → earnings per share are expected to reach $5.07, up 35.92% compared to the same quarter last year; → gross revenue is forecast to be $9.76 billion, an increase of 14.31% year-on-year.
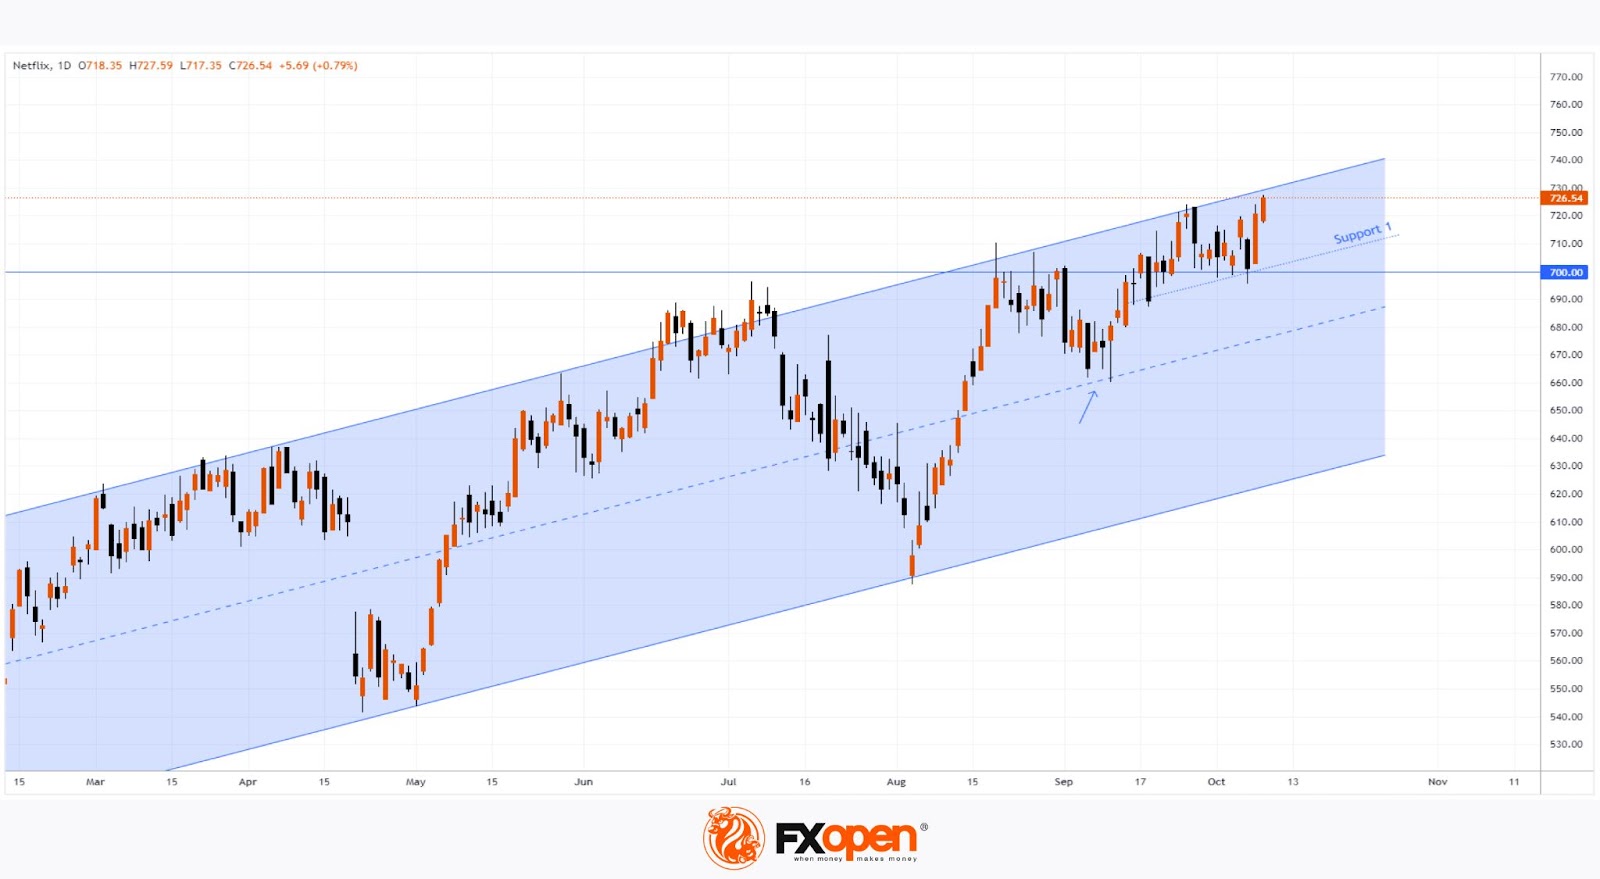
A technical analysis of Netflix’s (NFLX) daily chart indicates that the price is moving within an upward channel (shown in blue), which has been in play since the start of 2024. Specifically:
→ the price made a convincing recovery after the stock market’s panic-driven decline on 5 August;
→ the median line acted as support (indicated by an arrow);
→ since mid-September, the price has remained in the upper quarter of the blue channel;
→ while the psychological level of $700 showed resistance in late August, the NFLX price is now firmly holding above it.
These observations suggest strong buying pressure for NFLX shares. However, the current situation could be disrupted by the earnings release. What if the actual figures fall short of market expectations? In that case, a significant correction is possible – perhaps down to the channel's median line.
In the meantime, analysts maintain a cautiously optimistic outlook. According to TipRanks, out of 37 ratings, 25 analysts recommend buying NFLX shares, while 2 suggest selling. The average price target for NFLX is $720 over the next 12 months.
Buy and sell stocks of the world's biggest publicly-listed companies with CFDs on FXOpen’s trading platform. Open your FXOpen account now or learn more about trading share CFDs with FXOpen.
This article represents the opinion of the Companies operating under the FXOpen brand only. It is not to be construed as an offer, solicitation, or recommendation with respect to products and services provided by the Companies operating under the FXOpen brand, nor is it to be considered financial advice.
Stay ahead of the market!
Subscribe now to our mailing list and receive the latest market news and insights delivered directly to your inbox.


Latest articles

Market Analysis: GBP/USD Dips Further As EUR/GBP Regains Traction
GBP/USD failed to climb above 1.3500 and corrected some gains. EUR/GBP started a decent increase and might aim for more gains above 0.8700.
Important Takeaways for GBP/USD and EUR/GBP Analysis Today
· The British Pound


Market Insights with Gary Thomson: Oil, US Retail Sales & NFP in Focus
In this video, we’ll explore the key economic events and market trends, shaping the financial landscape. Get ready for insights into financial markets to help you navigate the week ahead. Let’s dive in!
In this episode of Market