


The Nikkei Index Has Risen To a Two-Month High
FXOpen

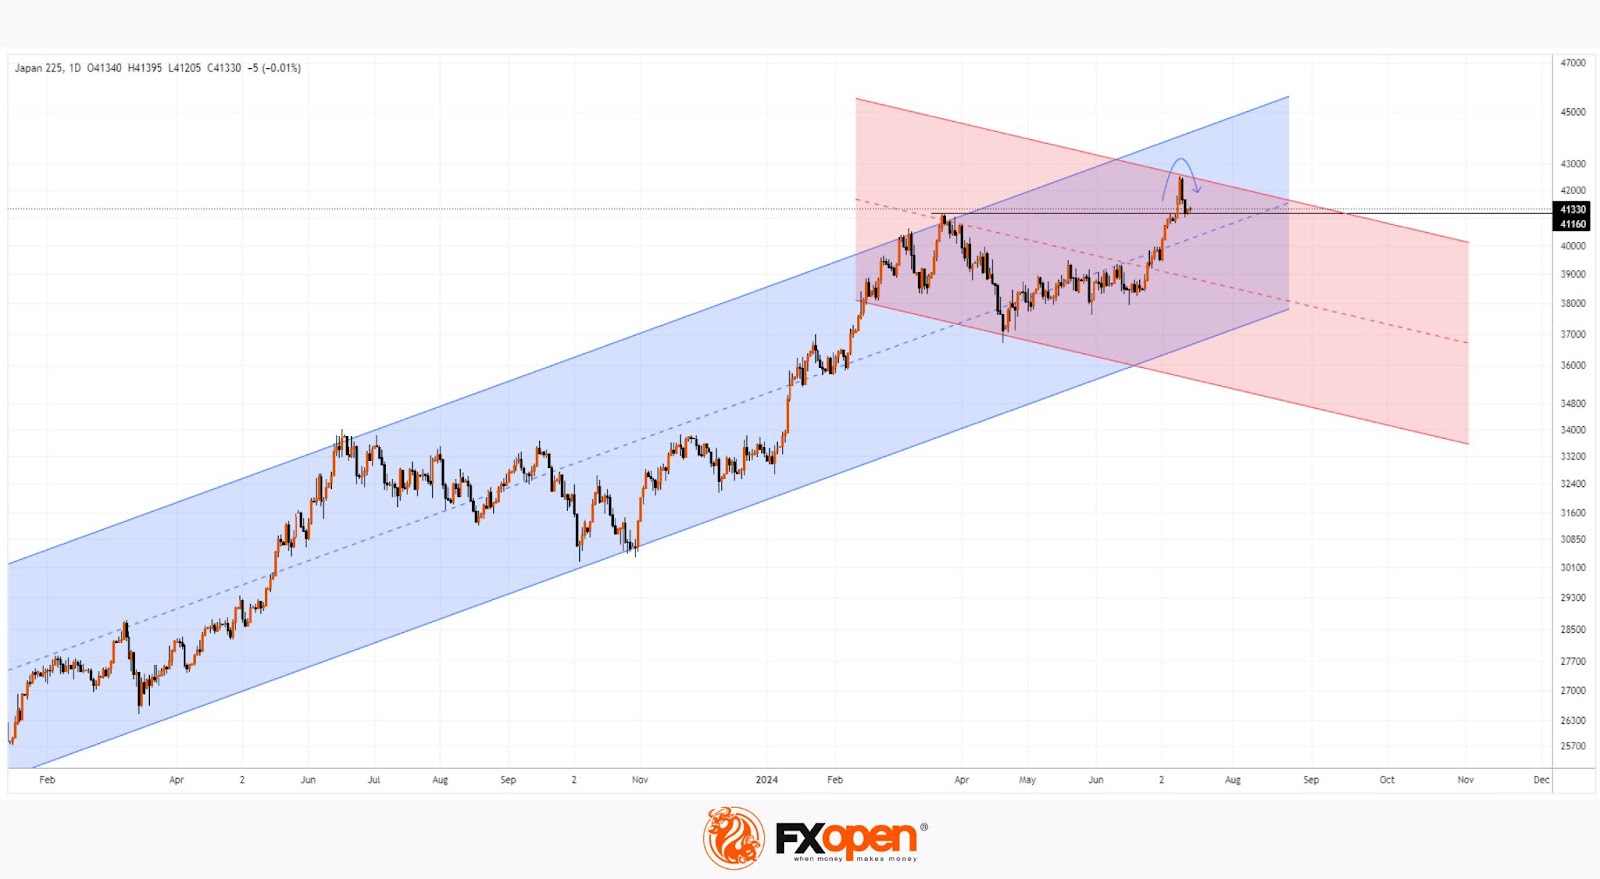
As we reported on 26th June, analysing the Nikkei 225 chart (Japan 225 on FXOpen):
→ The price is in a significant upward trend (shown by the blue channel);
→ The price may continue to rise along the median line.
Since then, the Nikkei 225 index (Japan 225 on FXOpen) has increased by more than 6%, reaching a yearly high on 10th July above 42,500 points. The price particularly surged on 9-10 July, breaking resistance at 41,160 (formed from the previous peak at the end of March).
However, the bears made a strong comeback afterwards, pushing the price back to the 41,160 level. Thus:
→ Completely offsetting the gains from 9-10 July;
→ Forming a bearish engulfing pattern spanning 4 candles;
→ Prompting consideration that the breakout above 41,160 was false (a trap for bulls).
According to Reuters, bearish drivers included technology stocks such as Tokyo Electron, which saw a more than 6% decline in one day, following sell-offs in US technology stocks (as reported on 12th July).
Sentiment in the Japanese stock market is also influenced by risks of interventions by the Bank of Japan to support the yen.
Technical analysis of the Nikkei 225 (Japan 225 on FXOpen) provides further insights:
→ The price is still in the upper half of a significant ascending channel (shown by the blue channel), originating in 2023;
→ There is no conclusive evidence yet that the price is consolidating below the 41,160 level.
However, it's possible that the bears could break below the median of the blue channel and consolidate below 41,160.
In that case, the bearish reversal from last week could become a key point in constructing an important descending channel for the Nikkei 225 index (Japan 225 on FXOpen), whose contours are already emerging (shown in red). Looking ahead to the second half of 2024, this suggests a potential break of the lower boundary of the blue channel.
Trade global index CFDs with zero commission and tight spreads (additional fees may apply). Open your FXOpen account now or learn more about trading index CFDs with FXOpen.
This article represents the opinion of the Companies operating under the FXOpen brand only. It is not to be construed as an offer, solicitation, or recommendation with respect to products and services provided by the Companies operating under the FXOpen brand, nor is it to be considered financial advice.
Stay ahead of the market!
Subscribe now to our mailing list and receive the latest market news and insights delivered directly to your inbox.


Latest articles

AI Valuations Are Back in the Spotlight
Artificial intelligence remains the dominant investment theme of 2026, but investors are increasingly questioning whether AI stock valuations are keeping pace with reality.
💰 Big Tech continues to invest at an unprecedented scale, with hyperscaler AI spending projected to exceed $800

AUD/CAD: Months of Indecision — Is a Breakout Finally Coming?
The Australian dollar has clawed back most of its end-of-June losses, when it touched three-month lows against the greenback amid escalating Middle East tensions. Since then, sentiment has improved: the RBA's Assistant Governor Sarah Hunter signalled the board stands ready

USD/JPY: Battling at the Top of the Triangle
On 3 July, Japan's Finance Minister, Satsuki Katayama, stated that the Ministry of Finance remains in close contact with US authorities regarding developments in USD/JPY as the yen traded near its weakest level in almost 40 years. Similar verbal