FXOpen
As the graph shows, yesterday, the price of the S&P 500 index exceeded the psychological level of 5,000 for the first time in history. Bullish sentiment in the US stock market is supported by 2 drivers.
Expectation of lower interest rates. So, yesterday, the head of the Minneapolis Fed, Neel Kashkari, noted that at the moment he expects two or three rate cuts this year.
Strong company reporting for the 4th quarter of 2023. At the end of last week, 46% of S&P 500 companies had reported. Of these companies, 72% reported earnings per share that were above expectations. The successes of technology giants attract particular attention.
As MarketWatch notes, if stocks act strongly in January, there is a significant chance that stocks will continue to rise. This year, the S&P 500 is up 2.5% since the start of January. And according to statistics since 1953, if the S&P 500 grew by 2% or more in January, it gained an average of 13.5% by the end of the year. The index showed positive dynamics in 84% of cases.
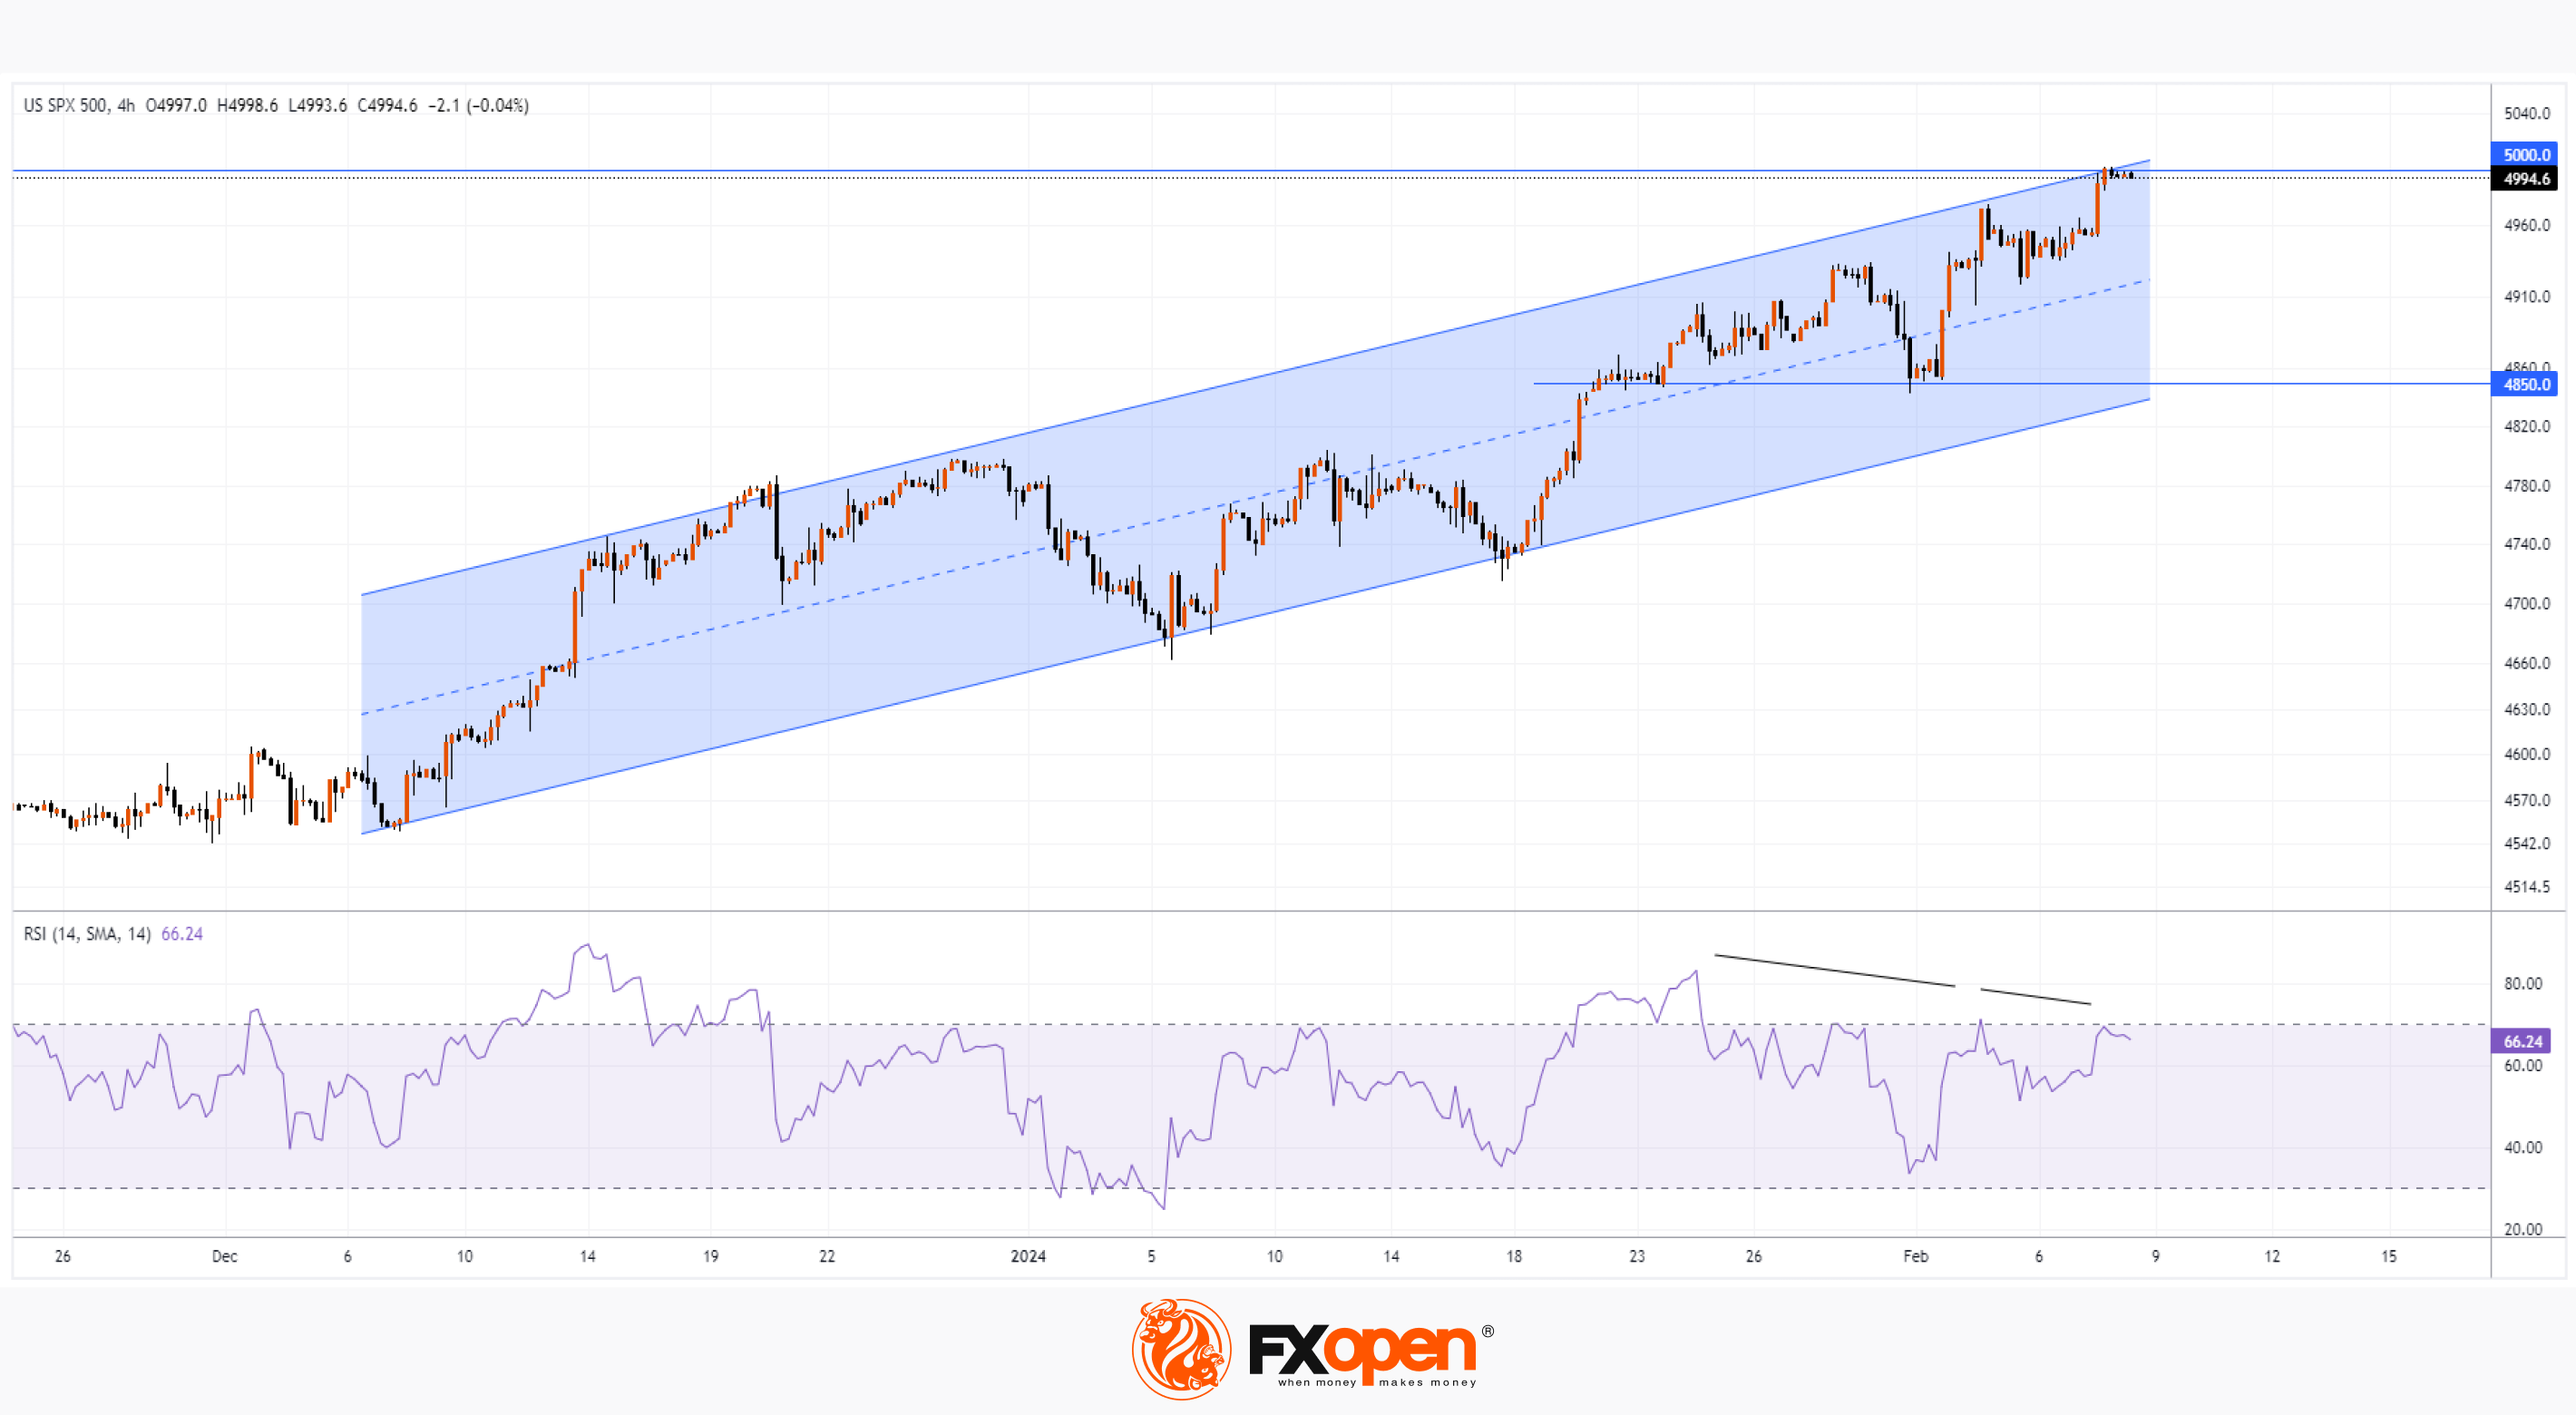
The S&P 500 chart today shows that the price is moving within the ascending channel (shown in blue). The slow and steady nature of the growth confirms the strength of bullish sentiment. However:
→ the RSI indicator indicates divergence;
→ the price is near the upper border of the channel.
Therefore, a correction is not excluded - then the psychological level of 5,000 points may become resistance. If a correction occurs, it is possible that the bulls will try to resume the rally from the support of 4,850, in the area of which the lower border of the mentioned ascending channel passes.
Trade global index CFDs with zero commission and tight spreads (additional fees may apply). Open your FXOpen account now or learn more about trading index CFDs with FXOpen.
This article represents the opinion of the Companies operating under the FXOpen brand only. It is not to be construed as an offer, solicitation, or recommendation with respect to products and services provided by the Companies operating under the FXOpen brand, nor is it to be considered financial advice.
Stay ahead of the market!
Subscribe now to our mailing list and receive the latest market news and insights delivered directly to your inbox.


Latest articles

Natural Gas Prices Rise Amid Middle East Conflict
The recent strike by Israel and the US, along with Iran’s retaliatory actions, has pushed energy asset prices higher. Yesterday, we reported on a bullish gap in oil markets, and while US natural gas prices have not surged as
The US Dollar Index (DXY) Climbs to a One-and-a-Half-Month High
Today, the US Dollar Index rose above the 98.70 level for the first time since the third week of January. Monday’s trading opened with a bullish gap, and upward momentum continues to build as news emerges of a