


The S&P 500 Index Approaches Historic High
FXOpen

On 2 August, we analysed the S&P 500 (US SPX 500 mini on FXOpen) chart, where we:
→ Constructed an ascending channel A-B with a median line shown as a dotted line;
→ Highlighted the risk of a bearish breakout (as indicated by the red arrow).
Since then:
→ The price dropped by more than 5% to the 5 August low, doubling the width of the A-B channel towards point C – the B line became the median of a wider channel. The index's decline was driven by recession fears, based on weak US labour market data;
→ However, the price then began to recover from the lower boundary of the wider channel, indicating that recession fears have subsided and the rally continues;
→ The price has now returned close to historical highs.
Yesterday, the minutes from the FOMC meeting on 30-31 July were released, revealing that the vast majority of participants noted that if data continues to align with expectations, it might be appropriate to ease policy at the next meeting.
The S&P 500 (US SPX 500 mini on FXOpen) index remained largely unchanged on this news – this indicates market participants' belief that interest rates will likely be cut in September, which would stimulate economic growth, company performance, and stock indices.
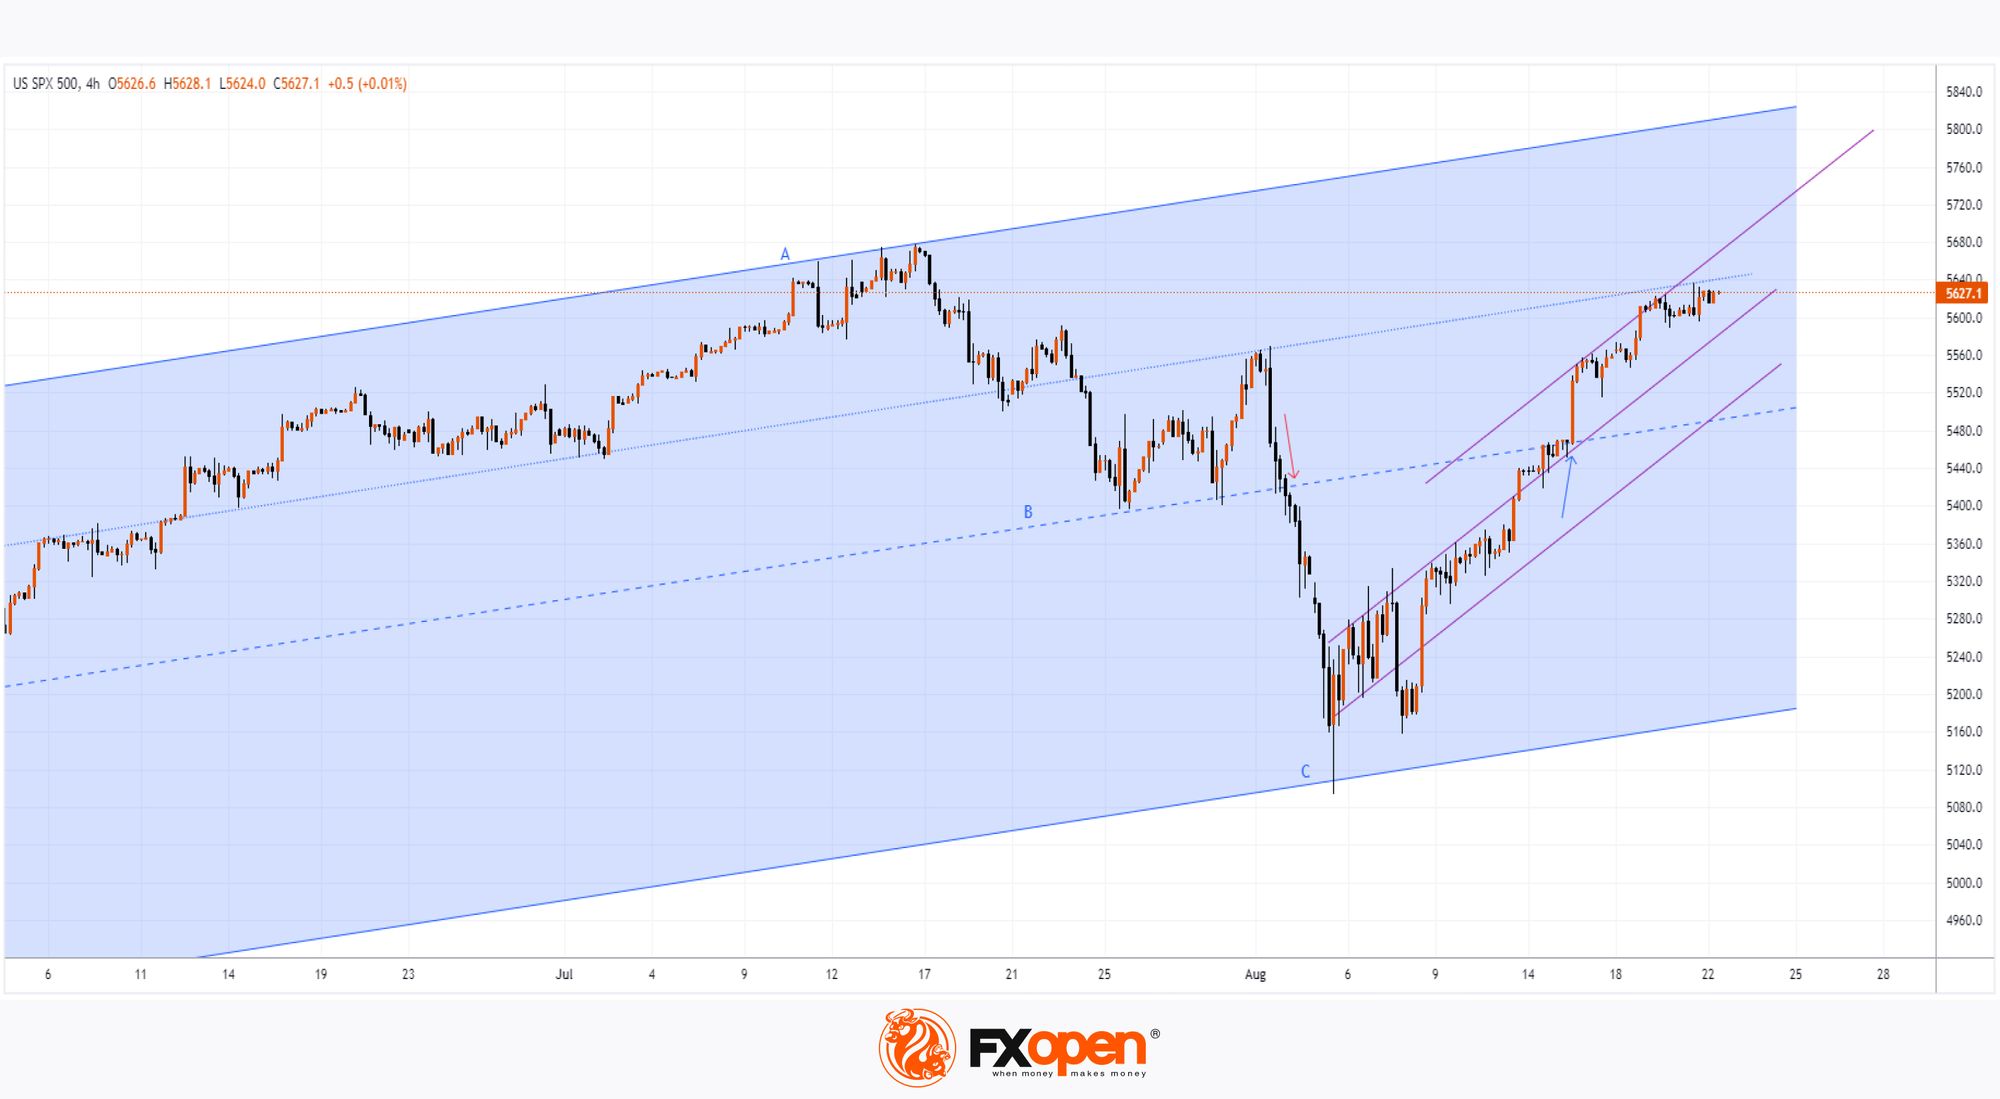
Technical analysis of the S&P 500 (US SPX 500 mini on FXOpen) chart today shows that:
→ On 7-8 August, bears attempted to resume the downward trend but failed;
→ In mid-August, price action made the trendlines shown in purple relevant;
→ On 15 August, the B line was confidently broken (indicated by the blue arrow);
→ The dotted line is showing signs of resistance.
Thus, it is reasonable to assume that bulls have regained control of the market after the sharp decline in the S&P 500 (US SPX 500 mini on FXOpen) in early August. If the sentiment remains unchanged, we could see attempts to reach a new historical high.
Trade global index CFDs with zero commission and tight spreads (additional fees may apply). Open your FXOpen account now or learn more about trading index CFDs with FXOpen.
This article represents the opinion of the Companies operating under the FXOpen brand only. It is not to be construed as an offer, solicitation, or recommendation with respect to products and services provided by the Companies operating under the FXOpen brand, nor is it to be considered financial advice.
Stay ahead of the market!
Subscribe now to our mailing list and receive the latest market news and insights delivered directly to your inbox.


Latest articles

CAD/JPY: The Yen's Most Historic Move in 30 Years Meets a Fragile Support
Two central banks are heading in genuinely opposite directions this week, and the tension is unmistakable. The Bank of Canada held rates steady at 2.25% on September 2, with a mildly hawkish tilt as policymakers acknowledged a broadening economic

USD/JPY and USD/CAD Await Key Fed Decision
The US dollar is consolidating against the yen and Canadian dollar ahead of the key event of the week — the Federal Reserve meeting. The Fed is widely expected to raise its policy rate by 25 basis points to a range

UnitedHealth: Fundamentals Are Healing, Now the Chart Must Agree
UnitedHealth finds itself in a genuinely split narrative right now, trading near $388, down about 15.9% from its 52-week high, even as the fundamental picture keeps improving. Q2 earnings beat expectations, with revenue of $112.03 billion, and the