


FXOpen

Today, the S&P 500 Index (US SPX 500 mini on FXOpen) is trading close to a new all-time high, having opened Monday above 6,675 points. This reflects continued optimism among market participants despite factors such as:
→ The risk of a U.S. government shutdown on 1 October.
Today, President Trump will meet with Democratic and Republican leaders in Congress to try to prevent a halt to government funding. However, Reuters reports that chances of reaching an agreement are slim. At the same time, Bank of America analysts remain calm, noting that a shutdown would shave only around 0.1% off GDP per week, and historically such closures have had little impact on financial markets.
→ Jerome Powell’s hawkish stance at the September Federal Reserve meeting.
Nevertheless, most market participants expect the Fed to make another move towards cutting rates at its next meeting on 29 October. The publication of the PCE index on Friday increased this likelihood, as the figures came in line with forecasts, reducing the risk of a renewed inflation surge.
Technical Analysis of the E-mini S&P 500 Chart
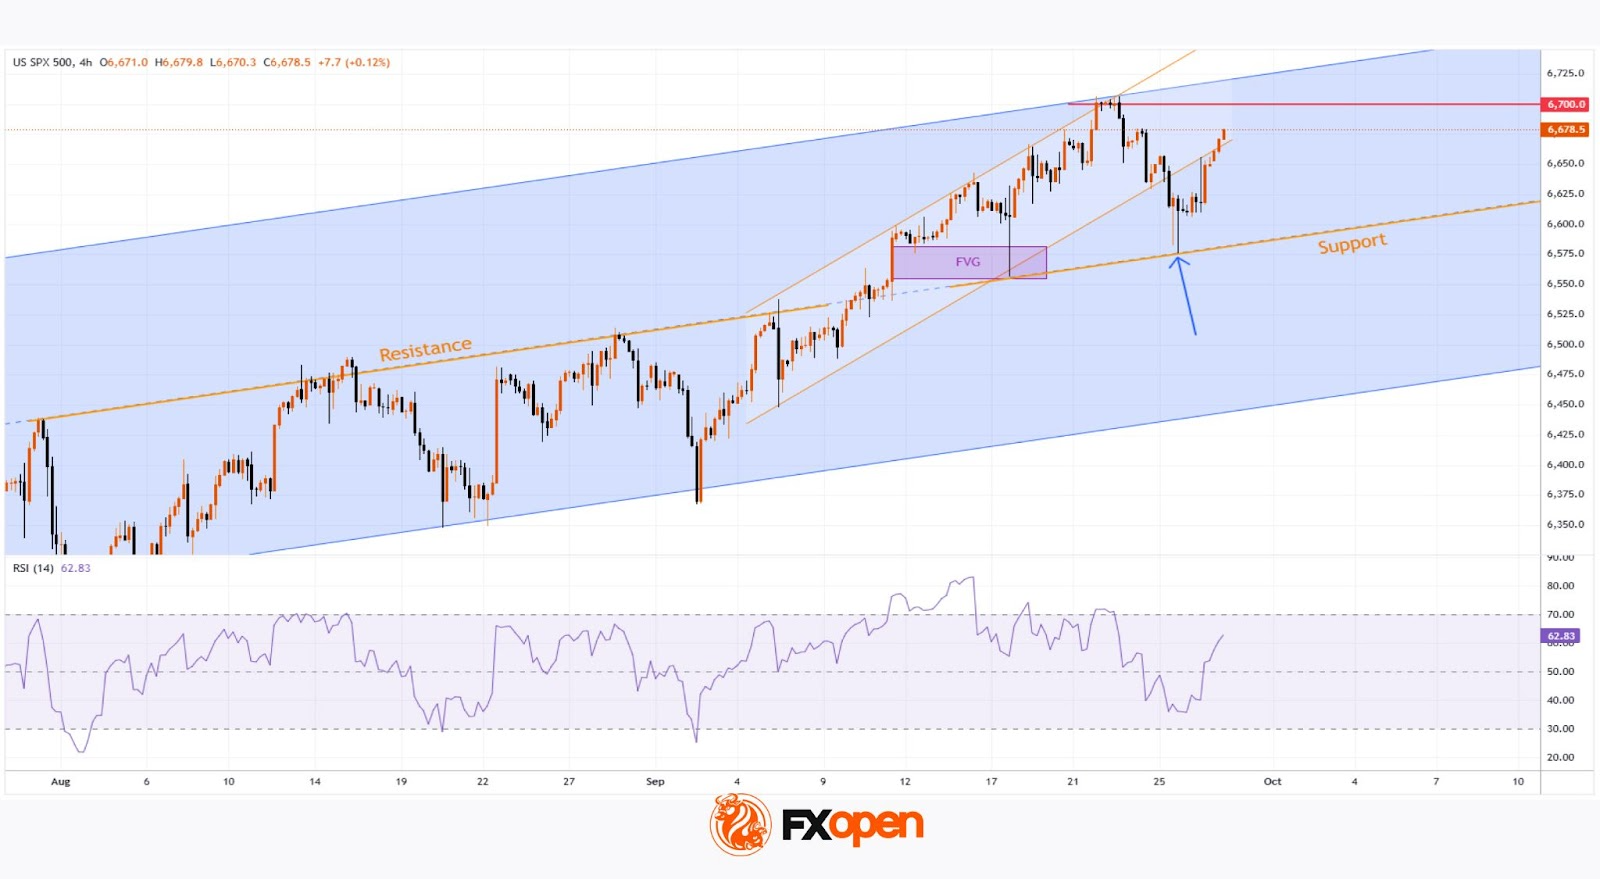
On 17 September, analysing the 4-hour chart of the S&P 500 Index (US SPX 500 mini on FXOpen), we noted:
→ the price continues to fluctuate within an ascending channel, highlighted in blue;
→ the long body of the bullish candle on 11 September points to strong buyer pressure, indicating an imbalance, or, in Smart Money Concept terminology, a Fair Value Gap (FVG).
At present, the channel remains relevant, but it has expanded — bullish sentiment has shifted the key line (marked in orange) from resistance to support. At the same time, the FVG zone has confirmed its role as support.
Possible developments: the chart indicates a buyer advantage:
→ strong demand near the channel’s median (evident in the long lower shadows from Friday, marked with an arrow);
→ buying activity has been strong enough to push the price back (for now) within the ascending channel.
If buyer dominance continues, this could lead to a new all-time high, testing the upper boundary of the channel. From a bearish perspective:
→ the psychological level of 6,700 could act as resistance;
→ continued growth at Monday’s open could push the RSI indicator into overbought territory, creating potential for a correction.
However, as long as the S&P 500 Index (US SPX 500 mini on FXOpen) remains above the orange support line, there is reason to believe that the bulls remain in control.
Trade global index CFDs with zero commission and tight spreads (additional fees may apply). Open your FXOpen account now or learn more about trading index CFDs with FXOpen.
This article represents the opinion of the Companies operating under the FXOpen brand only. It is not to be construed as an offer, solicitation, or recommendation with respect to products and services provided by the Companies operating under the FXOpen brand, nor is it to be considered financial advice.
Stay ahead of the market!
Subscribe now to our mailing list and receive the latest market news and insights delivered directly to your inbox.


Latest articles

EUR/USD Chart Analysis: Pair Recovers Ahead of Fed News
On 10 March, analysing the EUR/USD chart, we:
→ considered the long-term descending channel, which remains relevant;
→ noted that the sequence of lower lows A–H was broken with the appearance of a higher peak I, with 1.1680 potentially

Nvidia (NVDA) Shares Set a March High
Nvidia shares experienced heightened volatility yesterday, with the price jumping to a March high during the Nvidia GTC 2026 conference, where Jensen Huang made several major announcements. According to media reports:
→ Nvidia unveiled a next-generation platform named after the astronomer

XTI/USD Chart Analysis: WTI Oil Price Fluctuates Near $100
For the third Monday in a row, trading in the oil market has opened with a bullish gap, although this time it is not as wide as the gap seen, for example, on 9 March. The reason for the volatility