


FXOpen

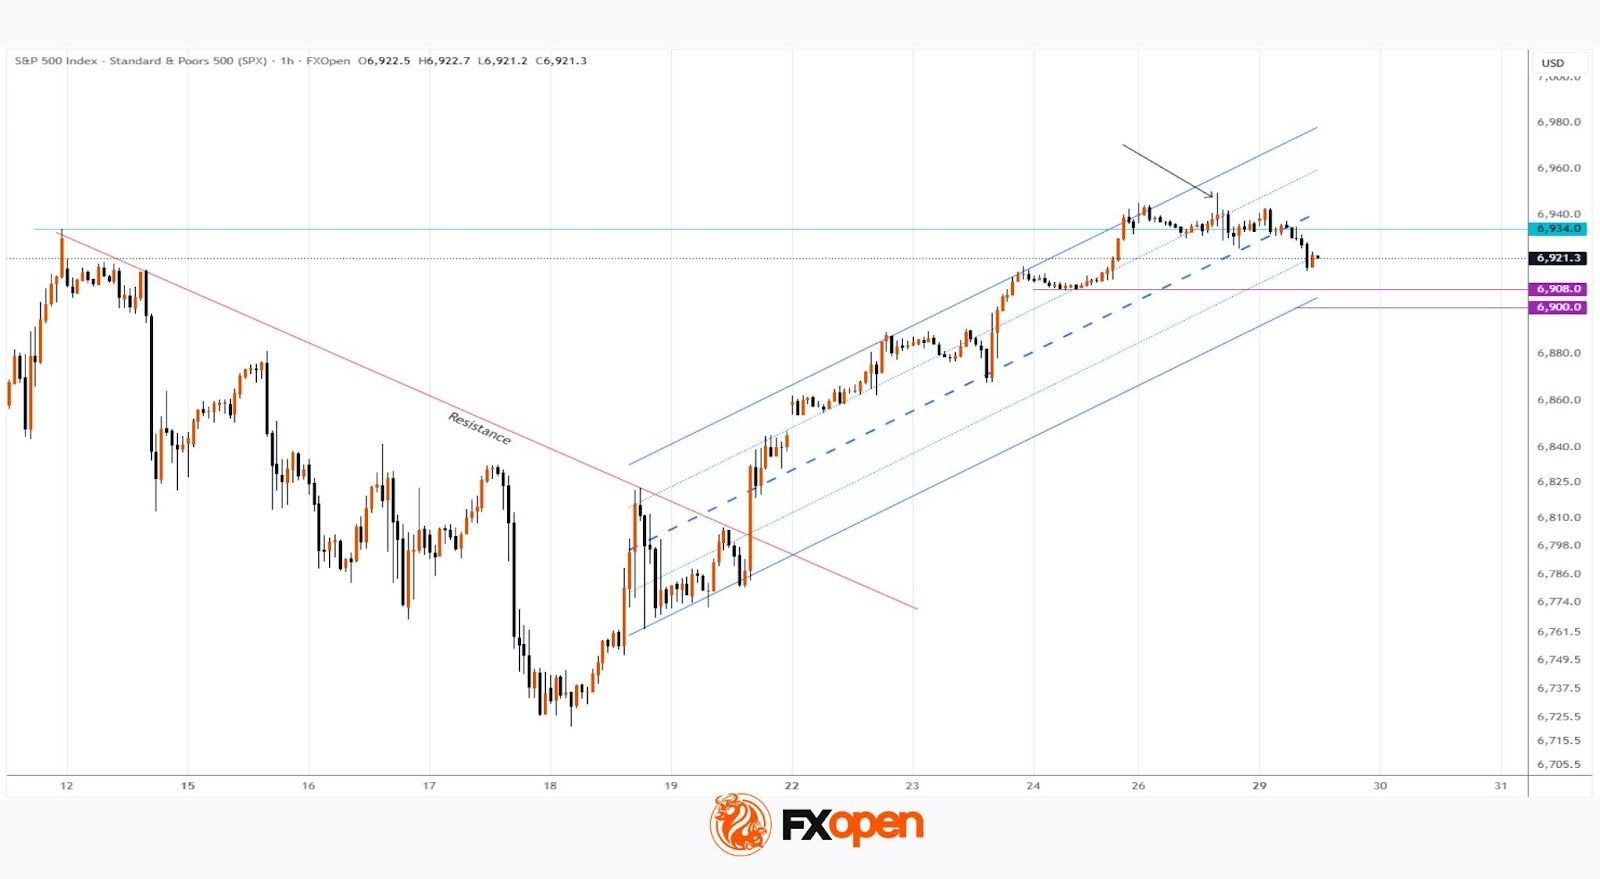
As indicated by the S&P 500 index chart (US SPX 500 mini on FXOpen):
→ After breaking above the resistance line (shown in red) in the third week of December, the equity market formed an upward trend, consistent with the typical characteristics of the Santa Claus Rally.
→ At the opening of trading in the final week of the year, the market is showing downward momentum. The index has slipped towards the 6,920 area, reflecting the sentiment of remaining market participants ahead of key news releases: the FOMC meeting minutes on 30 December and US labour market data on 31 December.
Technical Analysis of the S&P 500 Chart
Price action analysis points to a lack of conviction among bulls. After breaking above the 11 December high near the 6,934 level, further progress was limited, with the price failing to show signs of firm consolidation at record highs.
At the same time, bears became more active, as evidenced by the long upper shadow (marked by the arrow). Their pressure proved effective, resulting in a break below the median line of the ascending channel.
It cannot be ruled out that bearish momentum will continue, pushing the S&P 500 index (US SPX 500 mini on FXOpen) down towards a support zone formed by:
→ the psychological 6,900 level and the 24 December low near 6,907;
→ the lower boundary of the Santa Claus Rally ascending channel.
Trade global index CFDs with zero commission and tight spreads (additional fees may apply). Open your FXOpen account now or learn more about trading index CFDs with FXOpen.
This article represents the opinion of the Companies operating under the FXOpen brand only. It is not to be construed as an offer, solicitation, or recommendation with respect to products and services provided by the Companies operating under the FXOpen brand, nor is it to be considered financial advice.
Stay ahead of the market!
Subscribe now to our mailing list and receive the latest market news and insights delivered directly to your inbox.


Latest articles

EUR/USD Chart Analysis: Pair Recovers Ahead of Fed News
On 10 March, analysing the EUR/USD chart, we:
→ considered the long-term descending channel, which remains relevant;
→ noted that the sequence of lower lows A–H was broken with the appearance of a higher peak I, with 1.1680 potentially

Nvidia (NVDA) Shares Set a March High
Nvidia shares experienced heightened volatility yesterday, with the price jumping to a March high during the Nvidia GTC 2026 conference, where Jensen Huang made several major announcements. According to media reports:
→ Nvidia unveiled a next-generation platform named after the astronomer

XTI/USD Chart Analysis: WTI Oil Price Fluctuates Near $100
For the third Monday in a row, trading in the oil market has opened with a bullish gap, although this time it is not as wide as the gap seen, for example, on 9 March. The reason for the volatility