


The UK100 Price Plummeted After the Publication of Inflation Data
FXOpen

Yesterday, the stock market in the United Kingdom experienced a sharp decline following the release of new inflation data. The UK100 price, reflecting the leading British stock index FTSE, dropped approximately 1.5%. Moreover, the RSI indicator on the 4-hour chart fell below the value of 18 for the first time since July 2023.
Analysts attribute this decline to the published inflation data, which not only failed to meet economists' expectations but also indicated a possible strengthening of inflationary pressure in the country. CPI values: actual = 4.0%, expected = 3.8%, previous value = 3.9%.
This raised concerns among investors regarding the Bank of England's future steps in managing interest rates and the potential slowdown in the country's economic growth.
Sectors most sensitive to changes in interest rates, such as real estate and finance, showed the greatest decline. Significant decreases were also observed in the stocks of companies in the retail and consumer goods sectors, reflecting growing concerns about consumer confidence and spending.
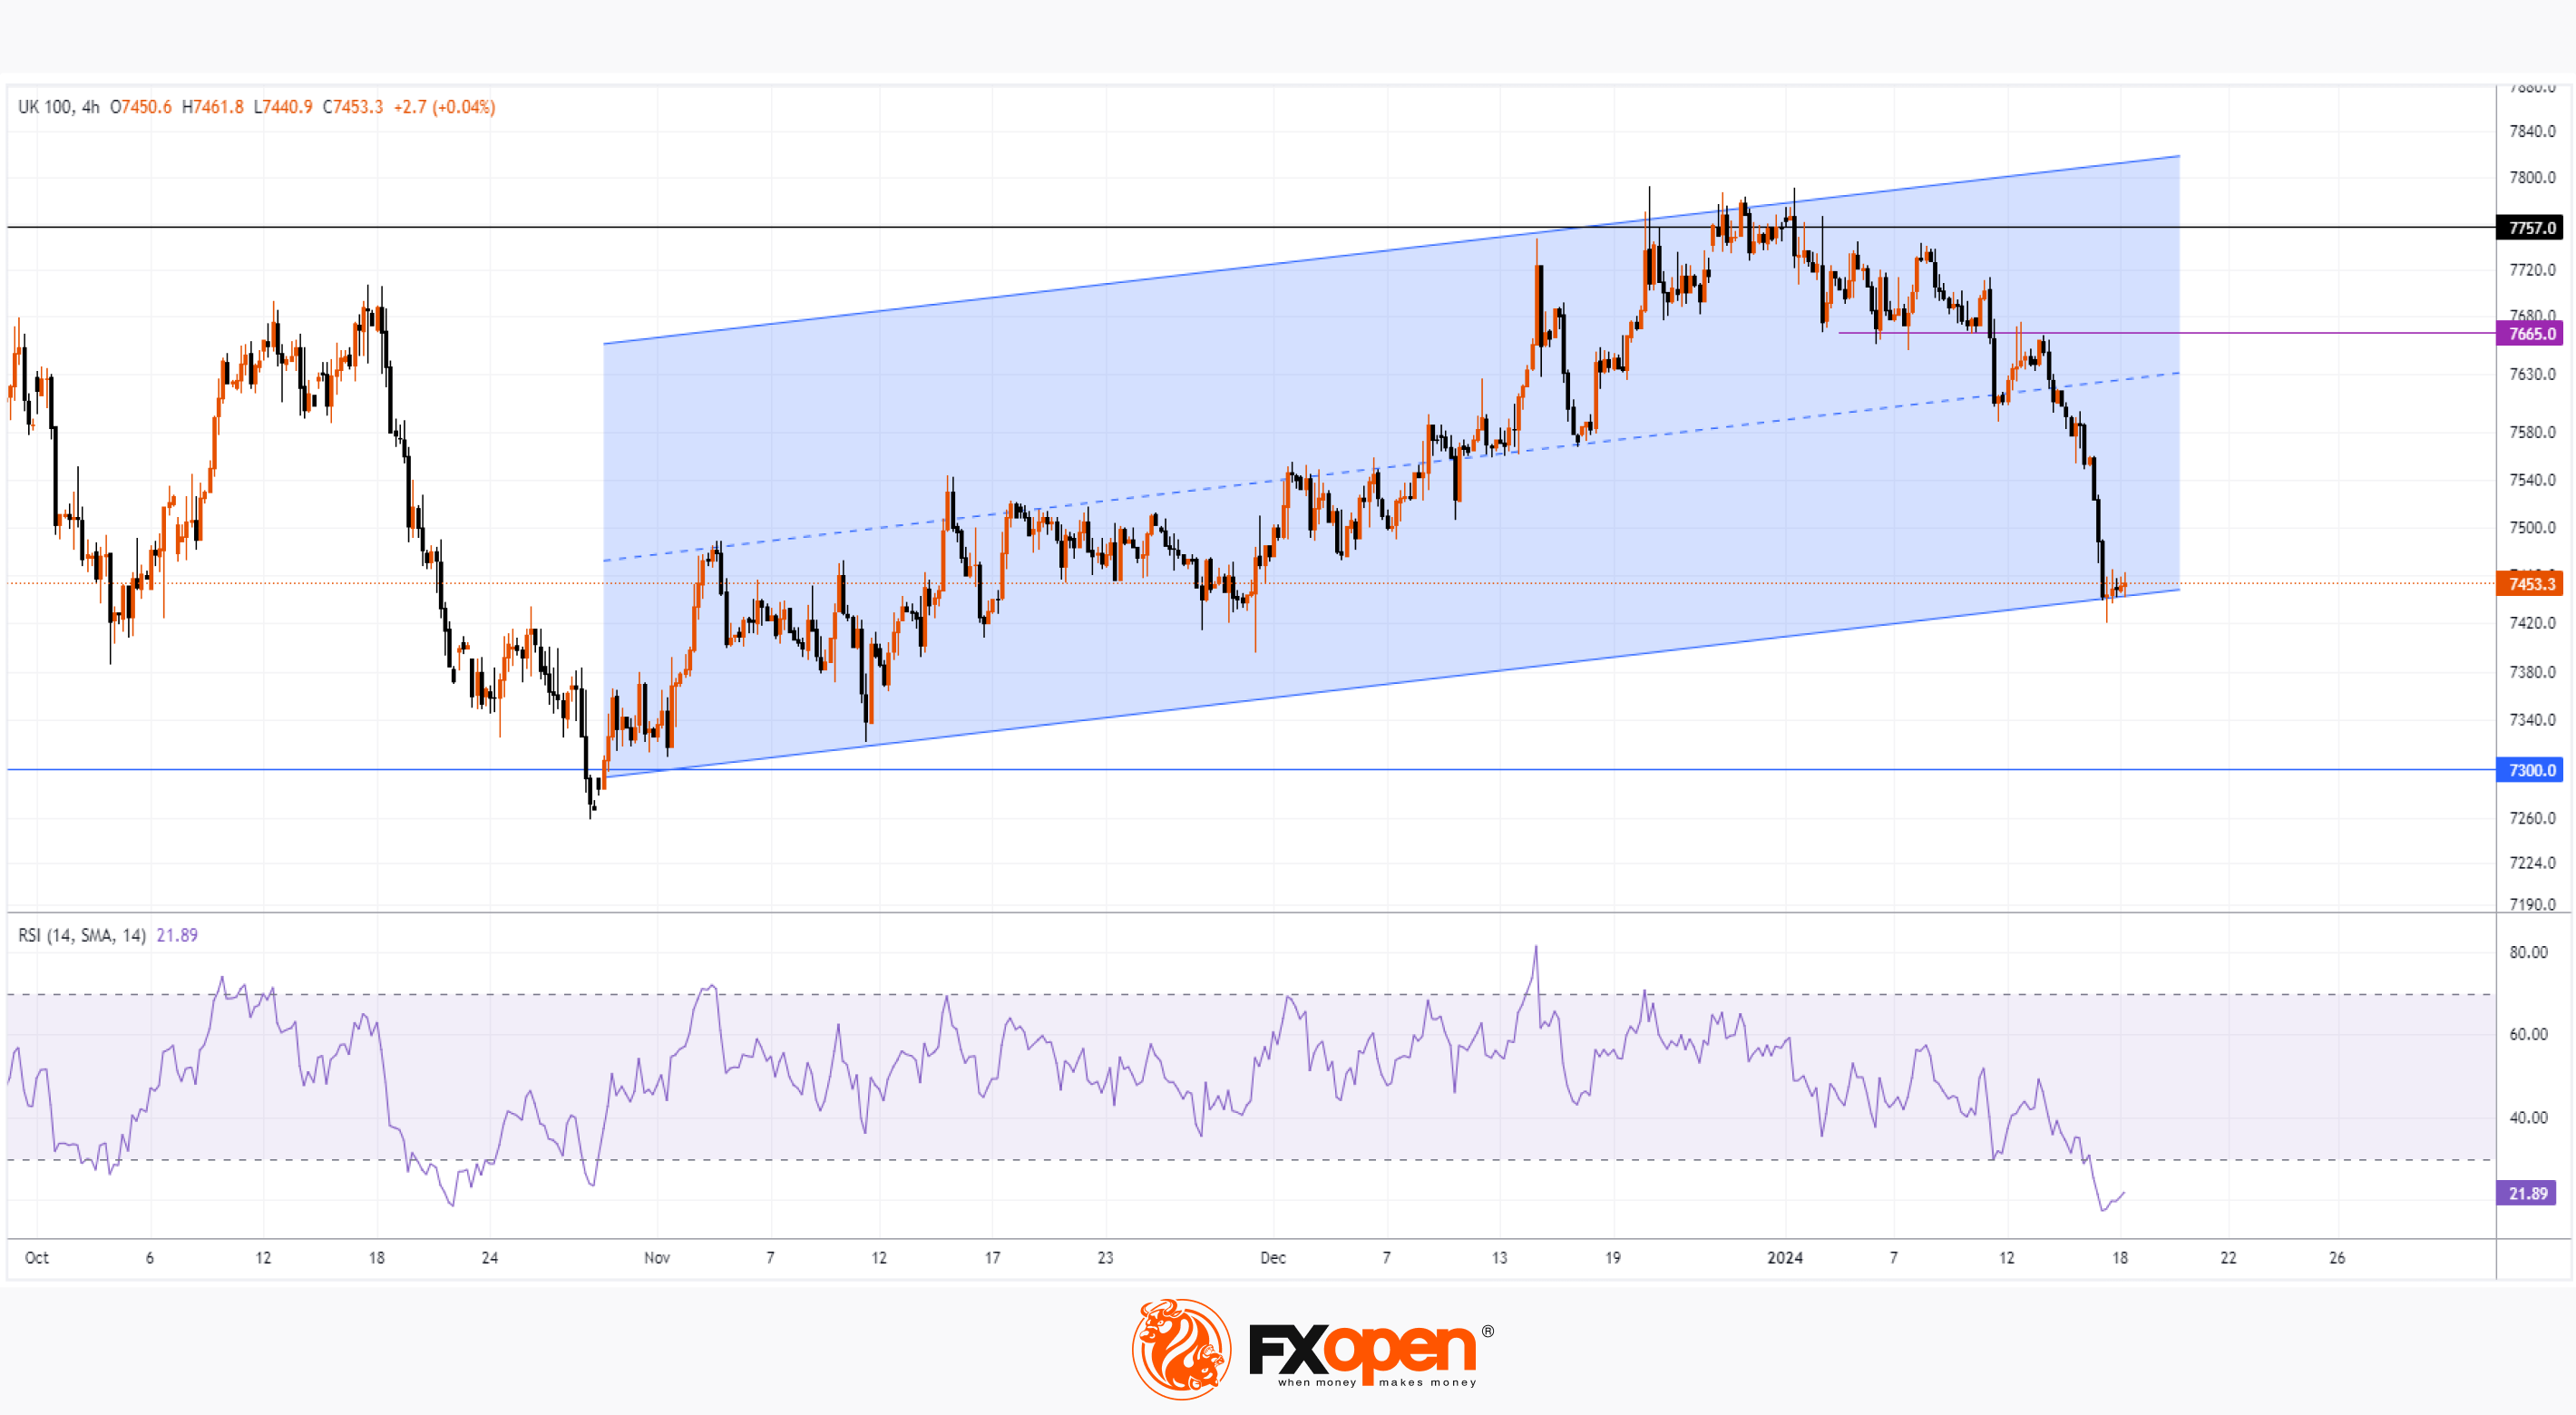
The UK100 chart shows that:
→ the price dropped to the lower boundary of the channel, indicated in blue;
→ market weakness could be inferred from the inability of the UK100 price to stay above the September maximum in December, as well as price action around the 7665 level, which switched roles from support to resistance.
If new negative news emerges for the stock market, support from the lower boundary of the channel may be breached. In that case, it is not excluded that the UK100 stock index will decline to the level of 7300, which served as strong support throughout 2023.
Trade global index CFDs with zero commission and tight spreads (additional fees may apply). Open your FXOpen account now or learn more about trading index CFDs with FXOpen.
This article represents the opinion of the Companies operating under the FXOpen brand only. It is not to be construed as an offer, solicitation, or recommendation with respect to products and services provided by the Companies operating under the FXOpen brand, nor is it to be considered financial advice.
Stay ahead of the market!
Subscribe now to our mailing list and receive the latest market news and insights delivered directly to your inbox.


Latest articles

AI Valuations Are Back in the Spotlight
Artificial intelligence remains the dominant investment theme of 2026, but investors are increasingly questioning whether AI stock valuations are keeping pace with reality.
💰 Big Tech continues to invest at an unprecedented scale, with hyperscaler AI spending projected to exceed $800

AUD/CAD: Months of Indecision — Is a Breakout Finally Coming?
The Australian dollar has clawed back most of its end-of-June losses, when it touched three-month lows against the greenback amid escalating Middle East tensions. Since then, sentiment has improved: the RBA's Assistant Governor Sarah Hunter signalled the board stands ready

USD/JPY: Battling at the Top of the Triangle
On 3 July, Japan's Finance Minister, Satsuki Katayama, stated that the Ministry of Finance remains in close contact with US authorities regarding developments in USD/JPY as the yen traded near its weakest level in almost 40 years. Similar verbal