


FXOpen

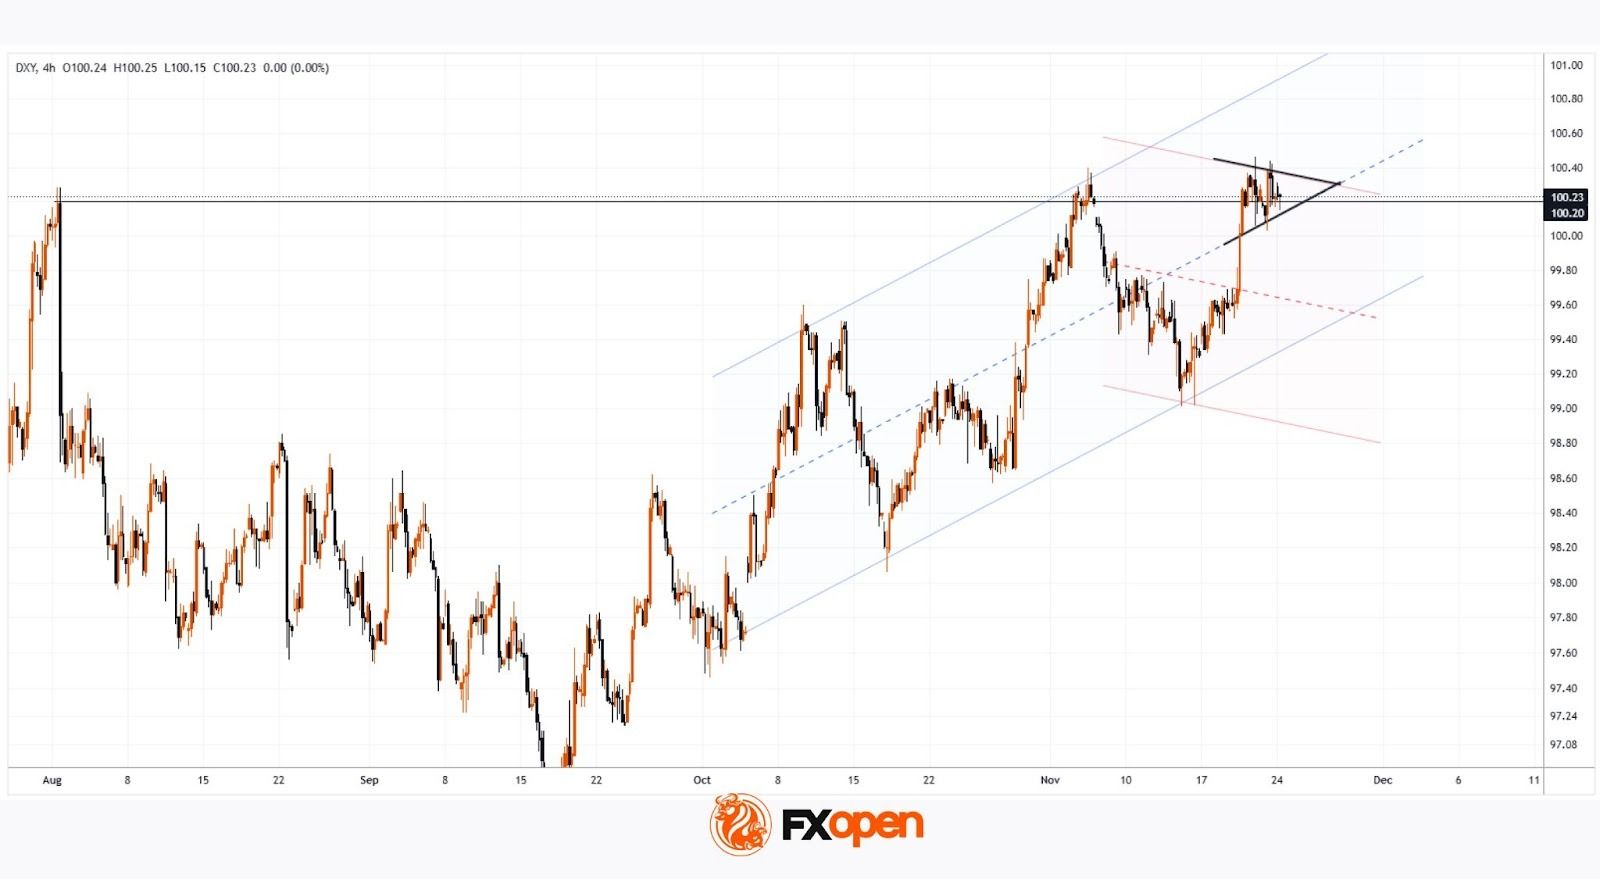
As the chart of the US Dollar Index (DXY) shows, today the value is sitting near an important resistance level around 100.20 points. We highlighted this level earlier — including in our analytical post from 10 November.
Fluctuations in the USD against other currencies are forming a configuration of two channels:
→ A blue bullish trajectory that began back in September. However, this resistance level appears to be a significant obstacle. Last week, the bulls attempted to push the DXY to a six-month high, but they failed to hold those gains.
→ A red alternative bearish trajectory, which may become more pronounced and relevant if the bears seize the initiative once it becomes clear that the bulls are running out of steam.
At the start of the week, the index is also moving within a narrowing triangle — the breakout direction may indicate the key trend into the year-end.
The balance between the two scenarios will largely depend on the fundamental backdrop, with traders mainly focusing on:
→ News related to the prospects of a Federal Reserve rate cut. Barclays analysts expect the Fed to cut rates in December.
→ A possible intervention by the Bank of Japan to support the weakened yen, which has come under pressure due to low domestic interest rates. Japan’s Finance Minister, Satsuki Katayama, reinforced this rhetoric last week.
→ The release of data — including US retail sales and producer prices — which were postponed due to the record-long government shutdown.
Trade global index CFDs with zero commission and tight spreads (additional fees may apply). Open your FXOpen account now or learn more about trading index CFDs with FXOpen.
This article represents the opinion of the Companies operating under the FXOpen brand only. It is not to be construed as an offer, solicitation, or recommendation with respect to products and services provided by the Companies operating under the FXOpen brand, nor is it to be considered financial advice.
Stay ahead of the market!
Subscribe now to our mailing list and receive the latest market news and insights delivered directly to your inbox.


Latest articles

Consolidation Ahead of NFP: Commodity Currencies Search for Direction
Commodity-linked currencies have entered a consolidation phase following recent directional moves, as market participants adopt a wait-and-see approach ahead of key US labour market data. Current price action reflects a balance between ongoing demand for the US dollar and attempts

The Real Driver Behind the Dollar Rally: Market Insights with Gary Thomson
The US dollar has been firm, but the drivers behind the move may be more complex than they first appear.
While geopolitical tension and shifts in risk sentiment play a role, current price behaviour seems increasingly influenced by inflation expectations

EUR/USD and USD/CHF Pull Back: Market Reacts to Fundamentals
European currencies have shown a recovery in recent trading sessions after their recent decline, displaying early signs of a reversal. The US dollar is weakening amid expectations surrounding upcoming US macroeconomic data, while market participants are reassessing their short-term positions