


TSLA Analysis: Price Recovers after Disastrous Report
FXOpen

We previously wrote that lower vehicle deliveries could lower TSLA's stock price.
And as it became known on Tuesday, Tesla, led by Elon Musk, delivered just 386,810 cars in the first three months of 2024 - 14% below analysts' forecasts, according to Bloomberg. As a result, Tesla shares fell 4.9% that day, extending their 2024 decline to 33%, the worst performance in the Nasdaq 100 Index.
What is the market outlook?
Bullish arguments:
→ After a strong disappointment on Tuesday, the price of TSLA showed signs of stability on Wednesday and Thursday. Since these were bullish candles, and the market was recovering despite the non-bearish gap on Tuesday, this can be interpreted as a sign of demand.
→ From the point of view of technical analysis, the market is supported by the lower border of the downward channel (shown in red). The price forms rebounds from this border, as shown by the arrows.
→ Bloomberg writes about a decrease in the number of short positions after the report on Tuesday. This could be a sign that short position holders do not see any further decline in the price of TSLA and are taking profits.
Bearish arguments:
→ TSLA price is still in the lower half of the downward channel, despite the bullish sentiment in the stock market.
→ Resistance may come from the level of USD 183 per share and the median line of the descending channel.
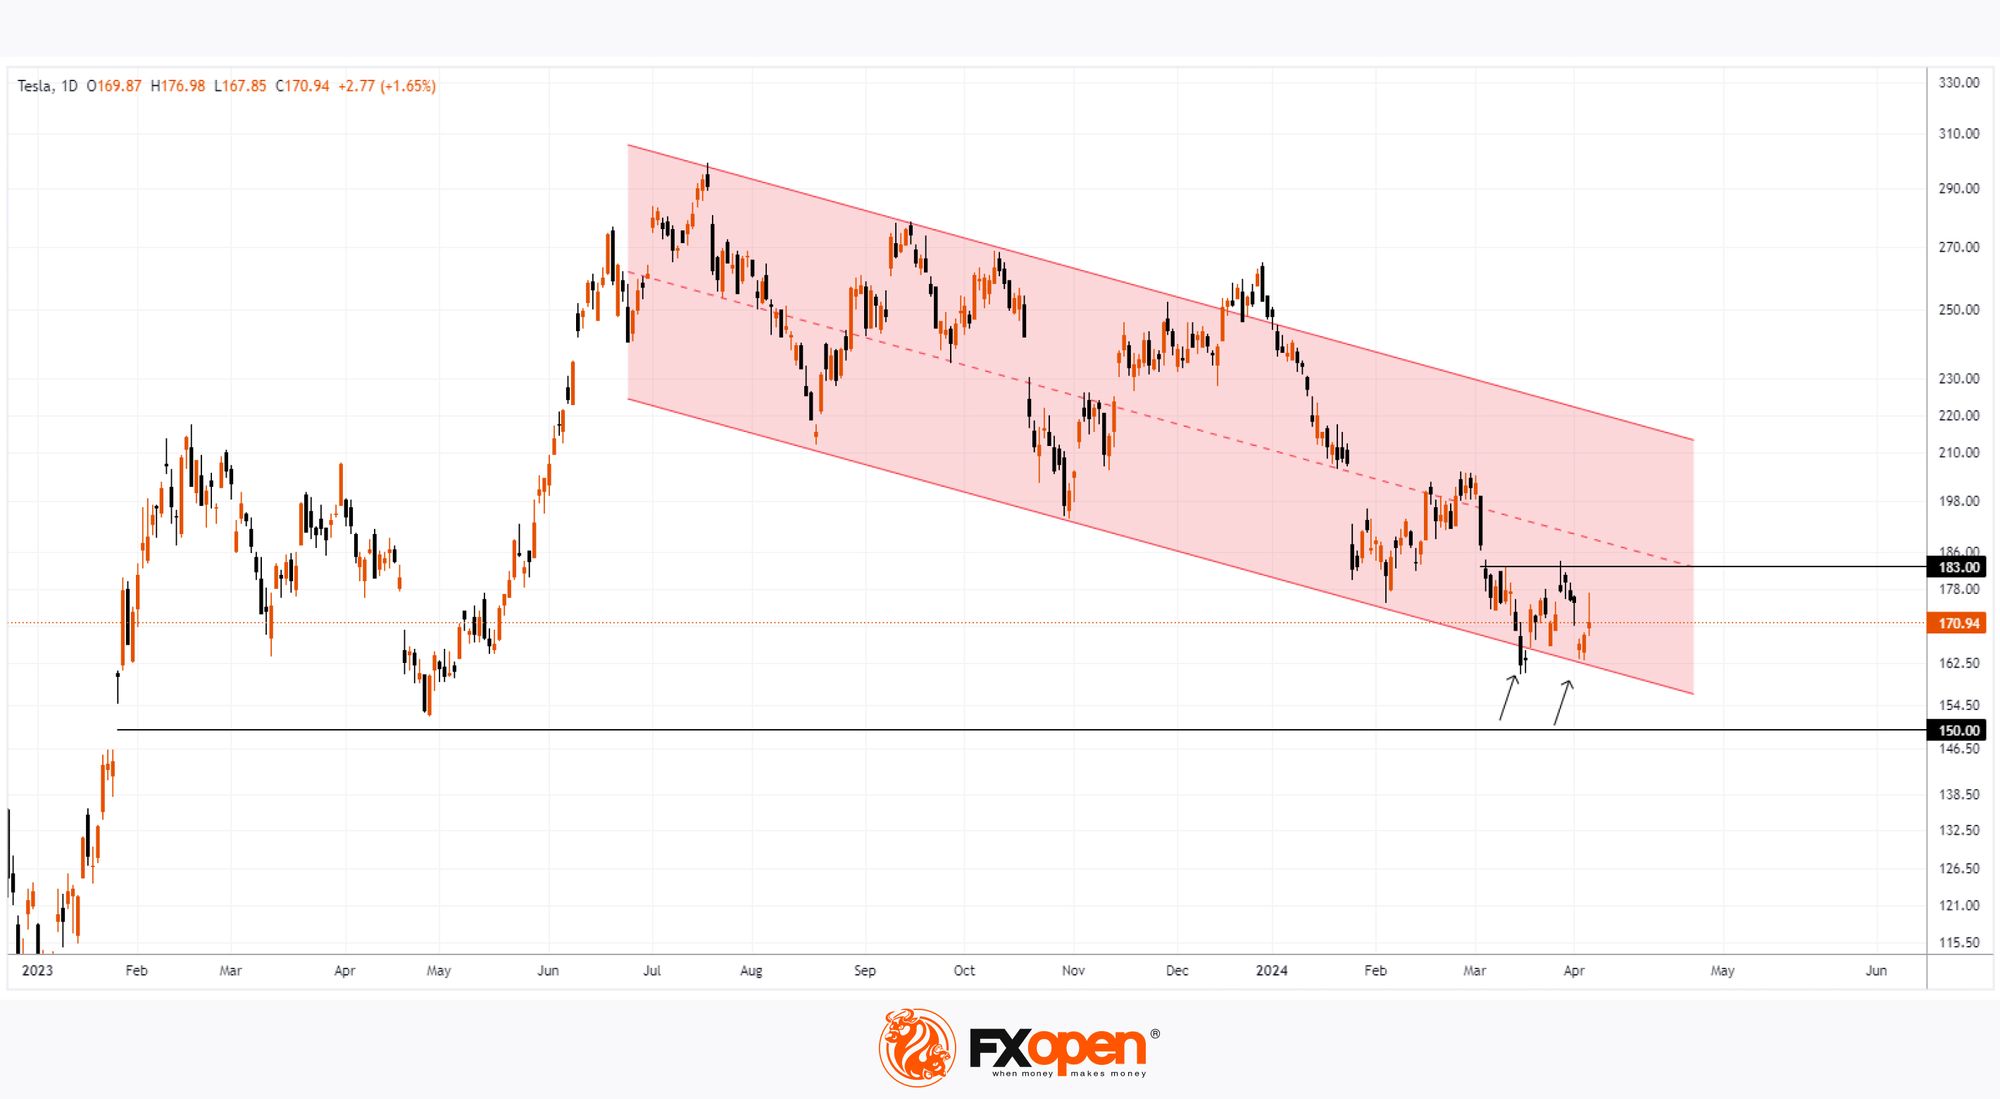
If the bears continue to dominate, the price of TSLA could fall towards the psychological level of USD 150 per share. But the balance of sentiment may be changed by the release of Tesla’s first-quarter reports, scheduled for April 17.
Buy and sell stocks of the world's biggest publicly-listed companies with CFDs on FXOpen’s trading platform. Open your FXOpen account now or learn more about trading share CFDs with FXOpen.
This article represents the opinion of the Companies operating under the FXOpen brand only. It is not to be construed as an offer, solicitation, or recommendation with respect to products and services provided by the Companies operating under the FXOpen brand, nor is it to be considered financial advice.
Stay ahead of the market!
Subscribe now to our mailing list and receive the latest market news and insights delivered directly to your inbox.


Latest articles

USD/CAD: One Trendline Away From Deciding the Next Move
After several strongly positive weeks, USD/CAD has stalled over the past few sessions, entering a phase of uncertainty.
On the dollar side, Fed Chair Kevin Warsh has struck a firm tone, reaffirming the 2% inflation target and pushing back

Amazon: New Bond Issuance to Fund AI Infrastructure
On 7 July, Amazon announced an eight-tranche bond offering worth at least $25 billion, with the proceeds expected to finance the construction of data centres and the expansion of its artificial intelligence infrastructure. Investor demand peaked at $62 billion, highlighting

Weekly Market Insights with Gary Thomson: US Inflation, UK GDP, Chair Warsh Testimony, and Earnings
In this video, we’ll explore the key economic events and market trends, shaping the financial landscape. Get ready for insights into financial markets to help you navigate the week ahead. Let’s dive in!
In this episode of Market