


TSLA Analysis: Share Price Leads Stock Market Growth
FXOpen

Yesterday, TSLA's share price rose 7%, while the S&P 500 index also started the week positively, showing an increase of approximately 0.7%.
According to the media, the reason for the upward momentum was the fact that investment company Baird noted a number of positive factors that await Tesla in the 2nd half of the year, including the launch of Cybertruck. The company's analysts have set a Buy rating on TSLA shares with a target price of USD 300, which represents about 32% upside from Monday's closing price.
Bullish arguments:
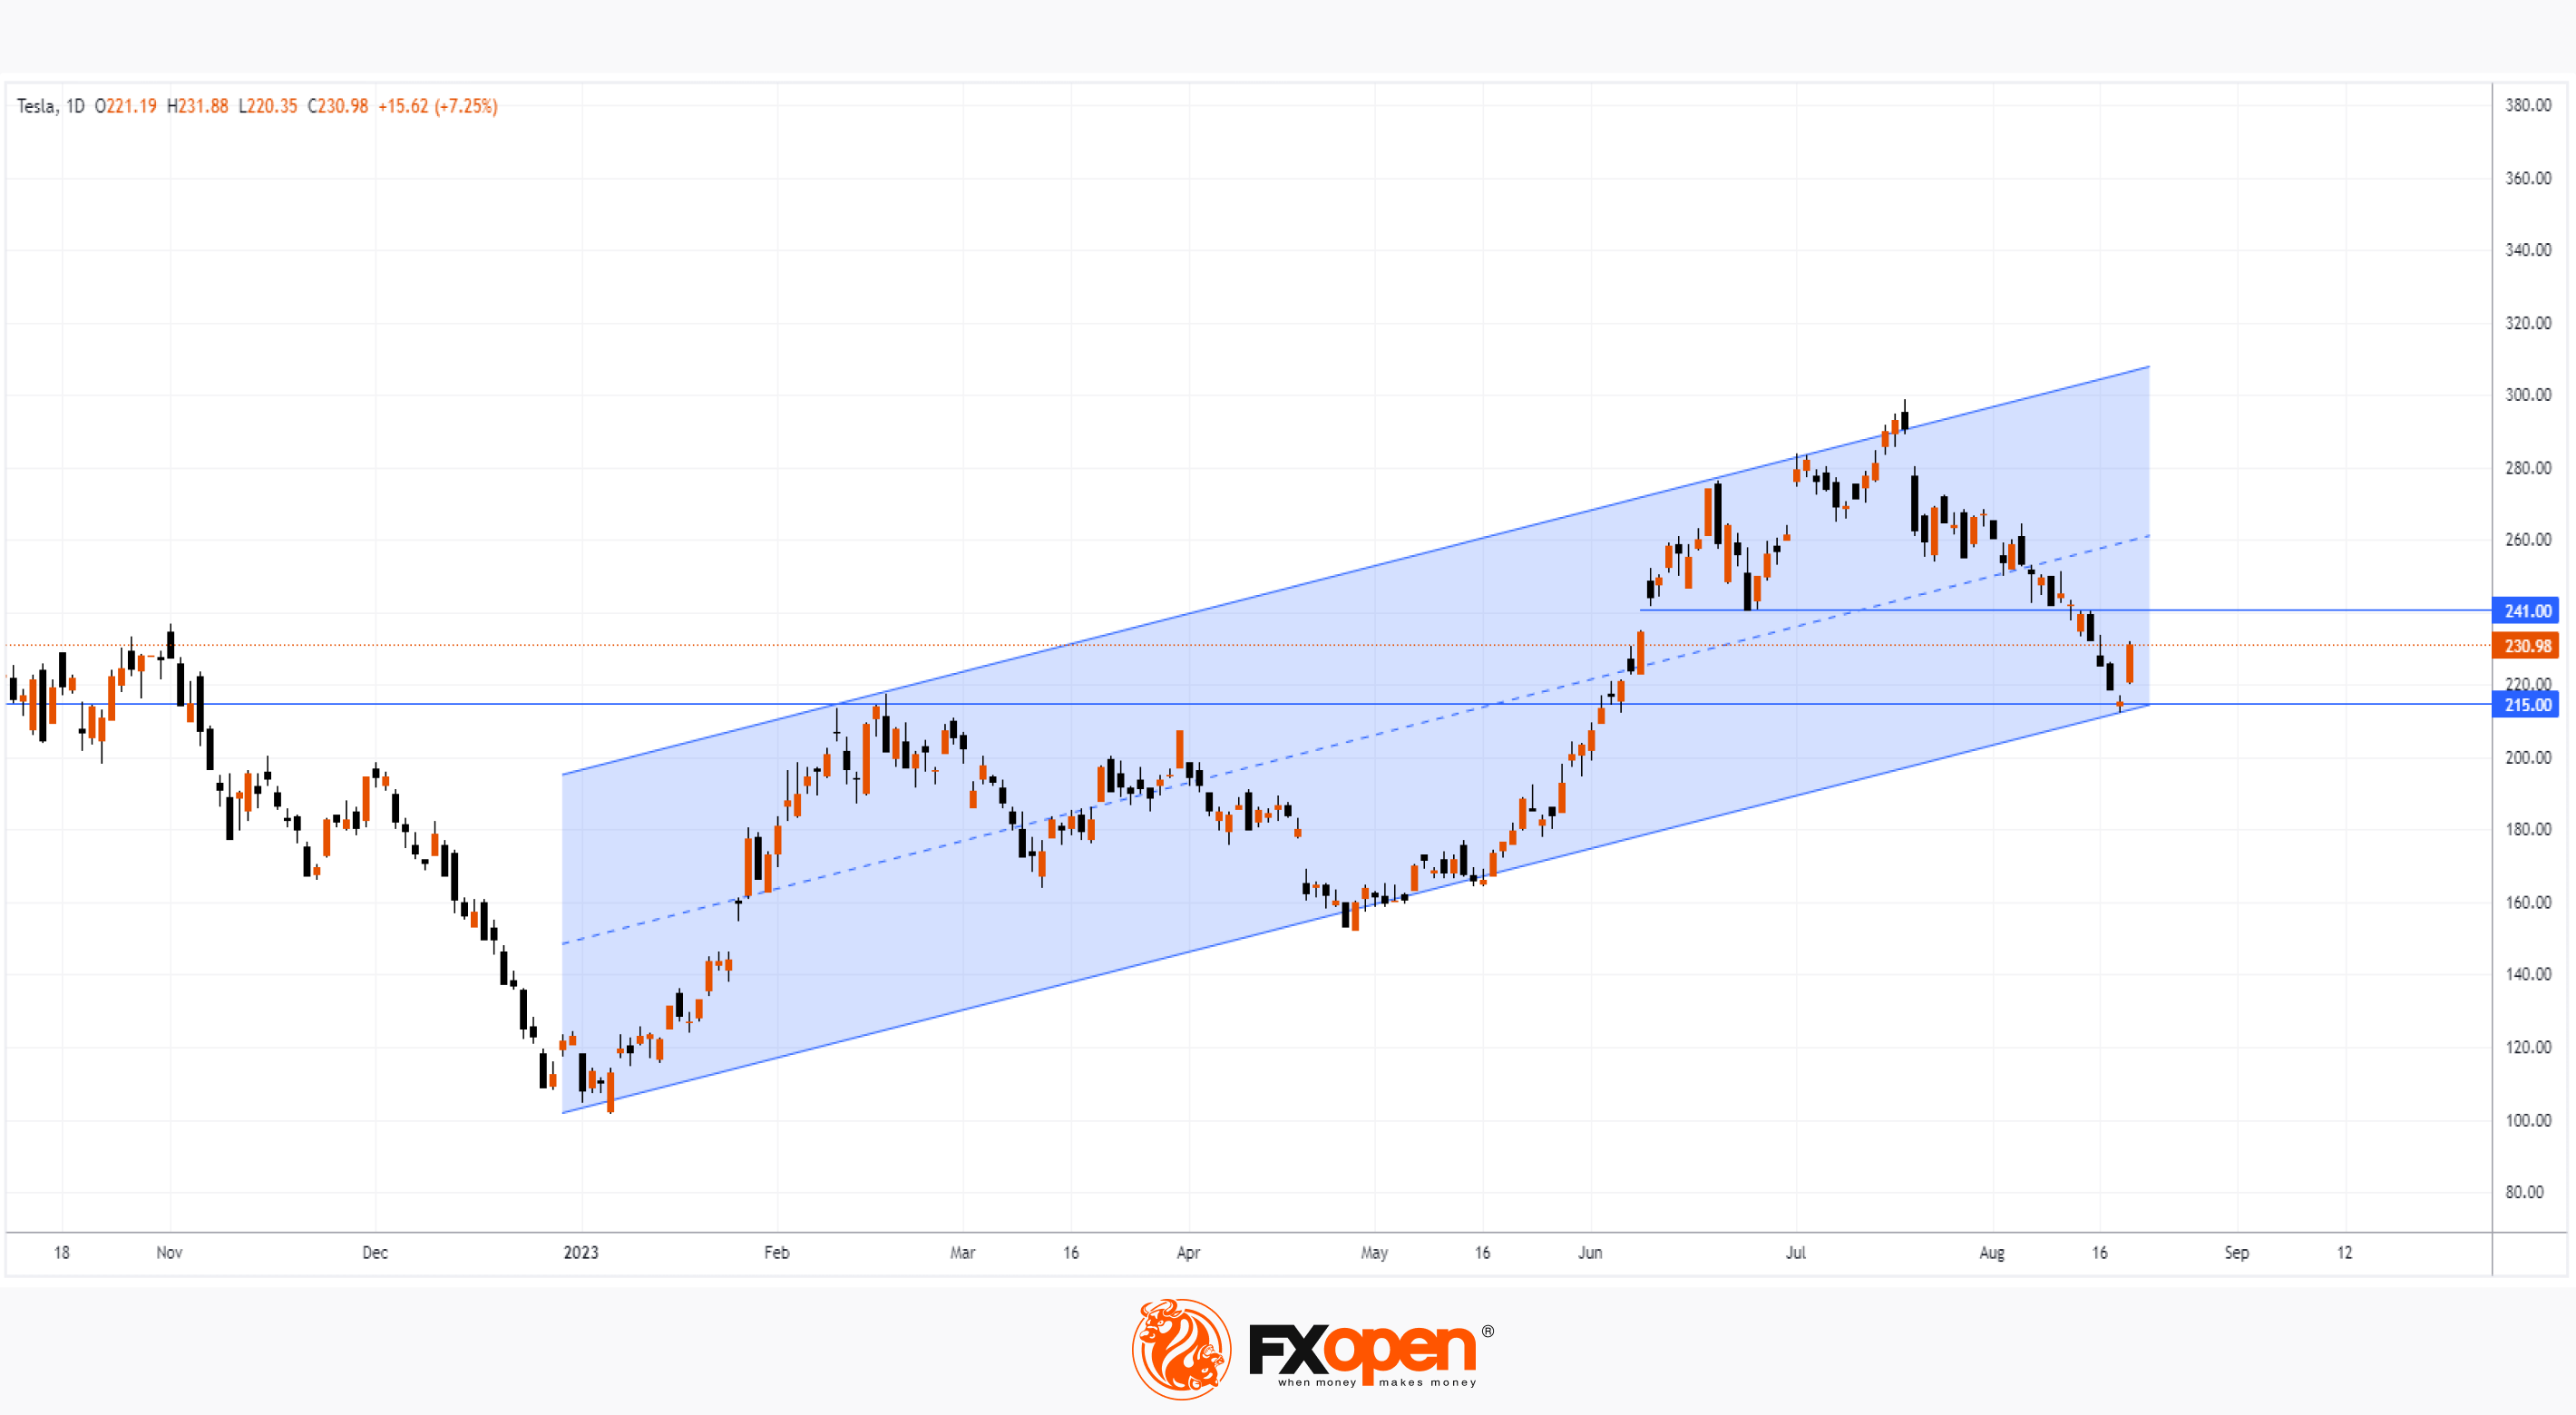
→ The price of TSLA bounced off the support block formed by the lower border of the rising channel and the level of USD 215, which served as resistance in February.
→ The August 18 doji candle indicated that the market may have found an equilibrium of supply and demand after a series of bearish candles.
→ The price of the S&P 500 index found support near the lower border of the rising channel (see its construction, for example, in this post).
→ Yesterday's bullish momentum is the strongest since March this year, so it could spread to the following days.
Bearish arguments:
→ Former support at USD 241 looks capable of resisting the rising price of TSLA shares.
Buy and sell stocks of the world's biggest publicly-listed companies with CFDs on FXOpen’s trading platform. Open your FXOpen account now or learn more about trading share CFDs with FXOpen.
This article represents the opinion of the Companies operating under the FXOpen brand only. It is not to be construed as an offer, solicitation, or recommendation with respect to products and services provided by the Companies operating under the FXOpen brand, nor is it to be considered financial advice.
Stay ahead of the market!
Subscribe now to our mailing list and receive the latest market news and insights delivered directly to your inbox.


Latest articles

EUR/USD Eyes Gains As USD/CHF Weakness Deepens Again
EUR/USD started a fresh increase above 1.1700 and 1.1720. USD/CHF declined further and is now struggling below 0.7835.
Important Takeaways for EUR/USD and USD/CHF Analysis Today
· The Euro started a decent increase from

Apple: Earnings Day Above the Activity Zone
On 30 April, after the market close, Apple Inc. will release its financial results for the second quarter of fiscal 2026. The consensus forecast, based on estimates from 31 analysts, points to revenue of around $109.7 billion, with expected

USD/JPY and USD/CHF Near Key Levels: The Dollar Supported by the Fed
The US dollar continues to trend upwards following the Federal Reserve meeting, drawing support from the regulator’s moderately hawkish stance and comments by Jerome Powell. Markets interpret the Fed’s rhetoric as a signal that restrictive policy is likely