


FXOpen

According to media reports, Elon Musk has increased his stake in Tesla by more than one and a half times — previously, the billionaire owned approximately 13% of the shares, now he owns 20.5% of Tesla. And earlier it was reported that Musk wants to increase his stake in Tesla to at least 25%.
At the same time, the TSLA share price rose sharply in yesterday's trading by more than 6%, while the S&P 500 stock market index increased by “only” +0.6%.
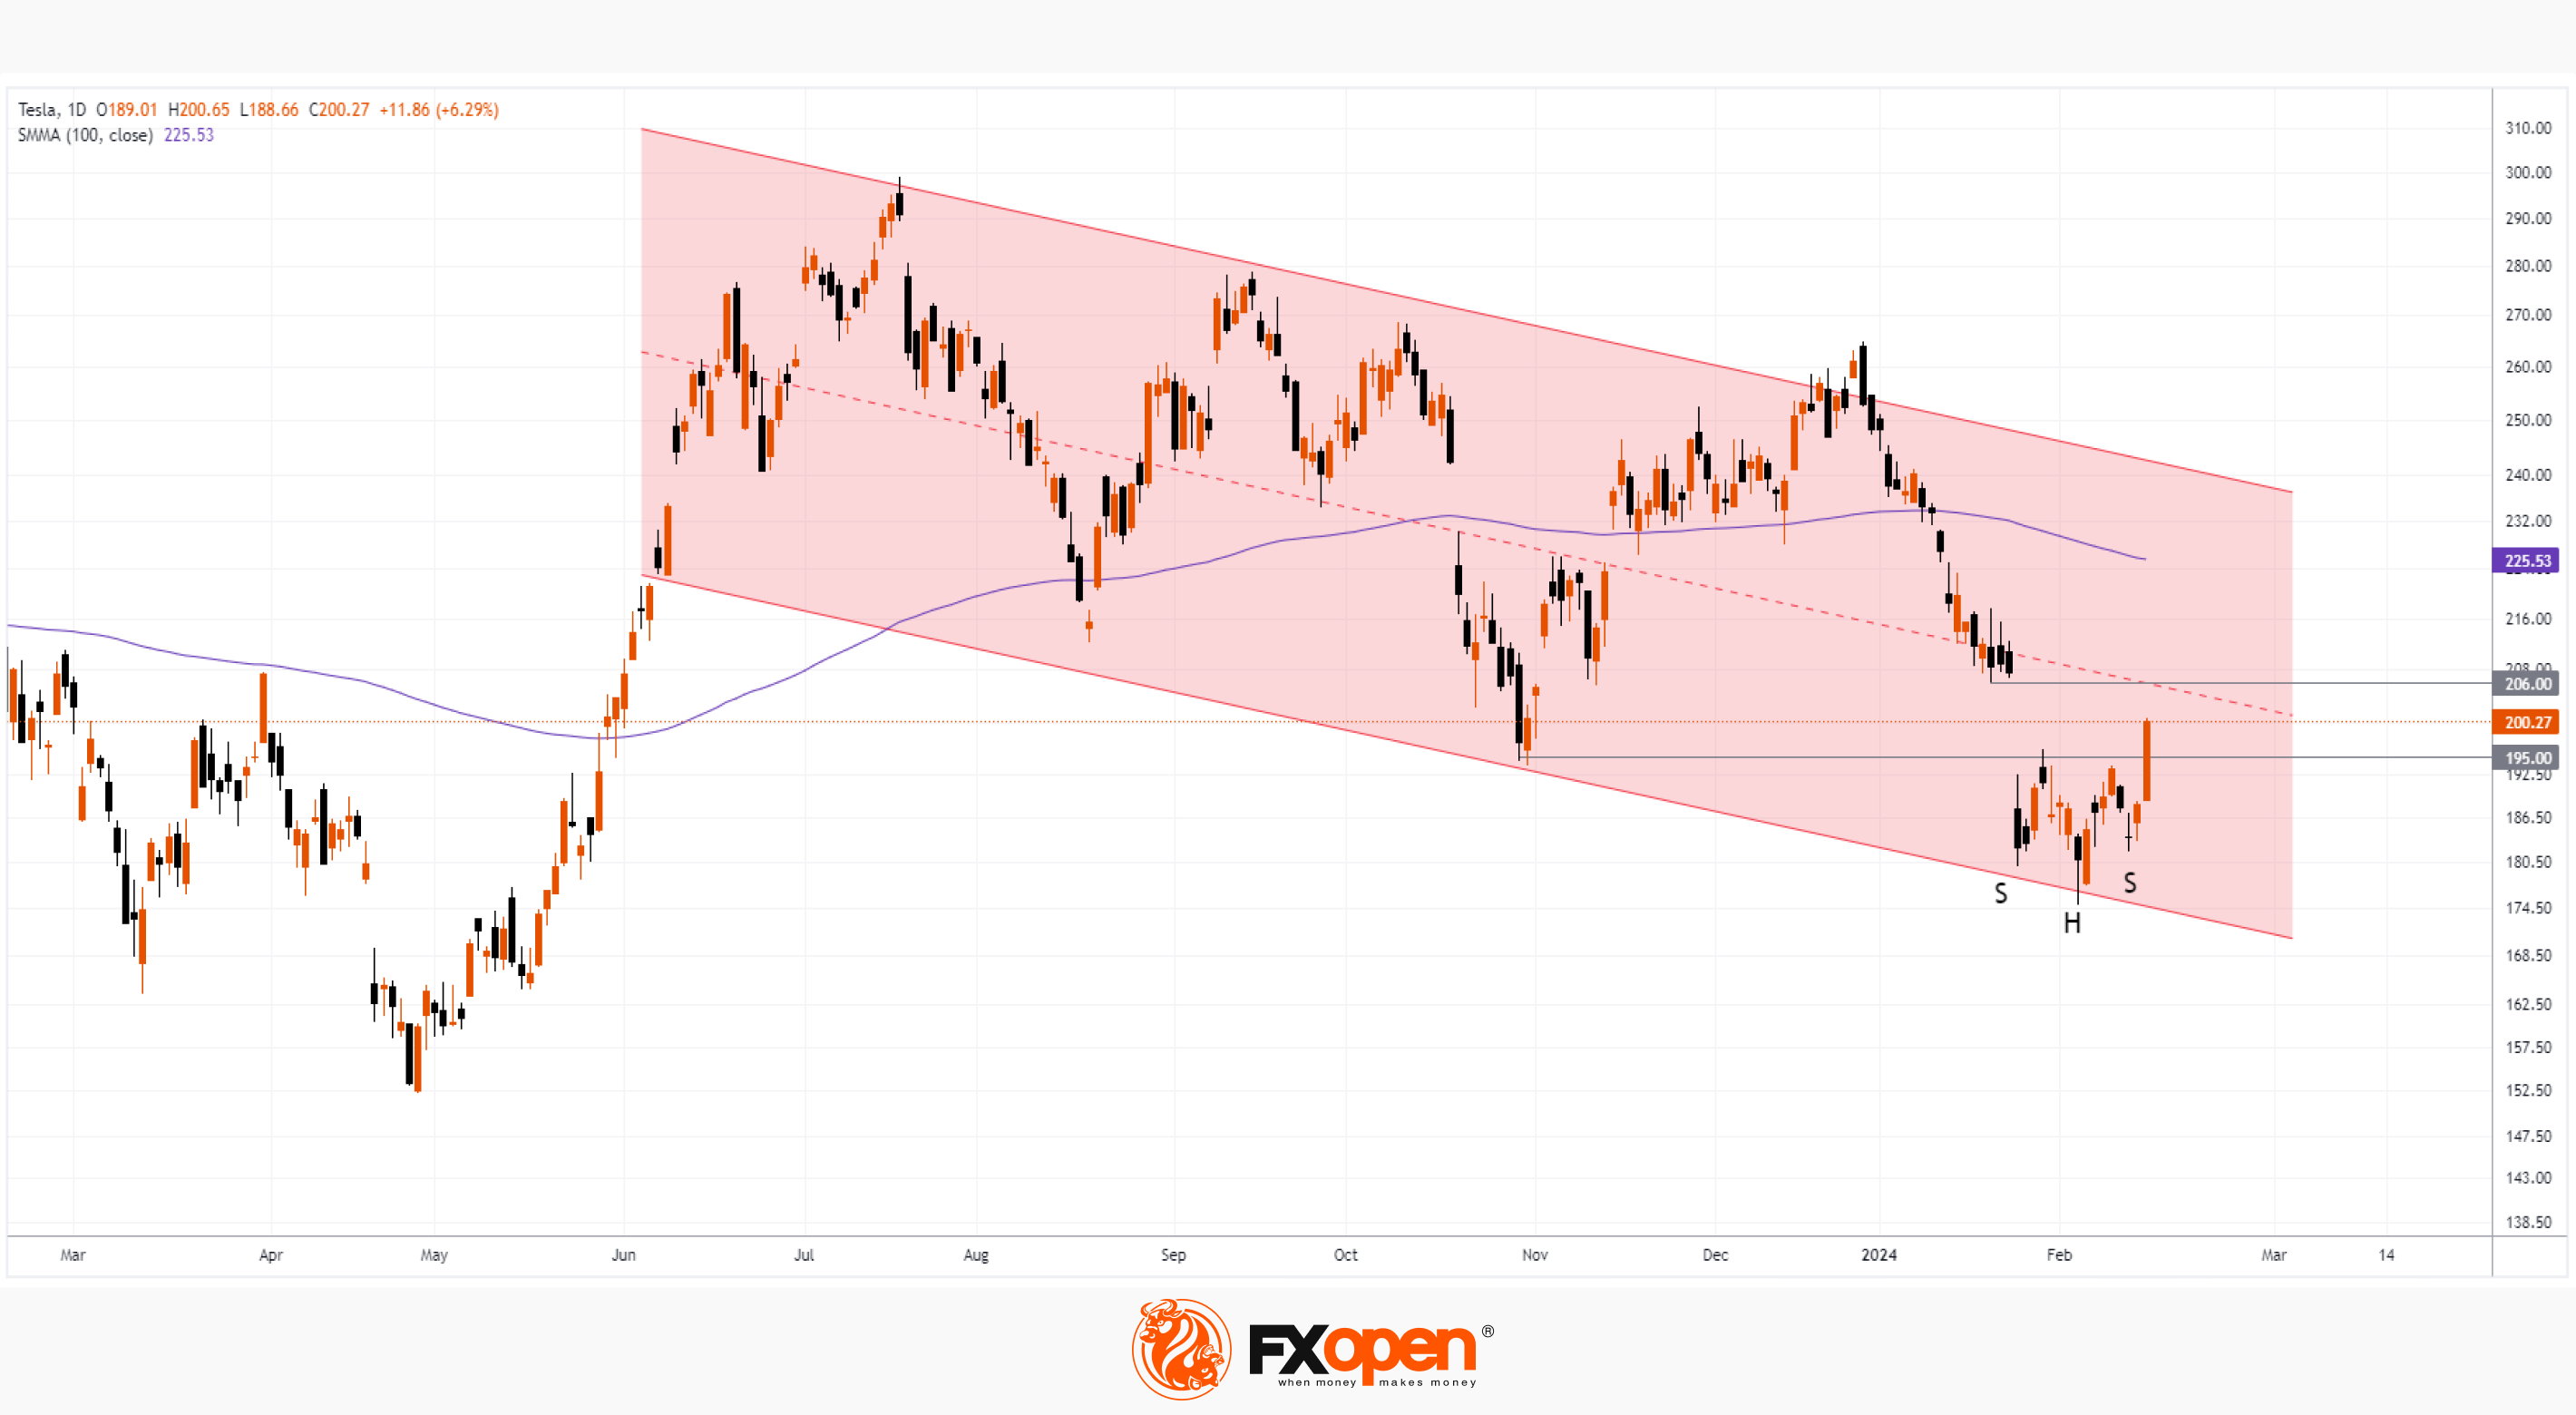
The TSLA stock chart today shows that:
→ the price has overcome the psychological mark of USD 200 per share;
→ the price has overcome the resistance level of USD 195 per share;
→ a bullish reversal pattern inverted head-and-shoulders has formed on the chart.
The situation gives hope to the bulls in a disadvantageous situation, because:
→ TSLA stock price is in a bearish trend (as shown by the red channel);
→ the last quarter report disappointed investors — and the price formed a wide bearish gap at the end of January.
How determined are the bulls, will they be able to break the trend? This will show their ability to overcome resistance levels:
→ 206.0 – in the area of the upper border of the gap;
→ median line of the descending channel;
→ SMA line (100) pointing down.
Buy and sell stocks of the world's biggest publicly-listed companies with CFDs on FXOpen’s trading platform. Open your FXOpen account now or learn more about trading share CFDs with FXOpen.
This article represents the opinion of the Companies operating under the FXOpen brand only. It is not to be construed as an offer, solicitation, or recommendation with respect to products and services provided by the Companies operating under the FXOpen brand, nor is it to be considered financial advice.
Stay ahead of the market!
Subscribe now to our mailing list and receive the latest market news and insights delivered directly to your inbox.


Latest articles

Market Analysis: AUD/USD, NZD/USD Struggle at Resistance, Upside Risks Diminish
AUD/USD is attempting a recovery wave from 0.6910. NZD/USD is also correcting losses and might recover if there is a clear move above 0.5885.
Important Takeaways for AUD/USD and NZD/USD Analysis Today
· The Aussie

Tesla (TSLA) Shares Surge Following Musk’s Announcements
According to the chart, Tesla (TSLA) shares had been under significant pressure since the start of 2026: from their December high, they had lost around 25% of their value. The main bearish drivers included:
→ Intense competition from Chinese automakers, particularly

XTI/USD Analysis: WTI Oil Prices Under Pressure from Trump’s Statements
Yesterday, following a false bullish breakout above the psychological $100 level, WTI crude prices fell sharply towards the $85 area. The primary driver of this rapid decline was comments made by the US President.
According to Donald Trump:
→ the United