


TSLA Stock: Price Chart Analysis
FXOpen

According to Bloomberg, the world's richest people got even richer in the first half of 2023. Musk tops the list with +USD 96.6 billion, followed by Zuckerberg with +USD 58.9 billion. The staggering growth in personal wealth is driven by the bullish stock market of META (up more than +140% since the beginning of the year) and TSLA (up more than +150% since the beginning of the year).
Perhaps to catch up with Musk, Zuckerberg gave the green light to the launch (scheduled for July 6) of Twitter's competitor, the Threads social network. Recall that Musk does not like this so much that he challenged Zuckerberg to a fight, and Zuckerberg agreed. Negotiations are underway with UFC managers about holding a billionaire fight.
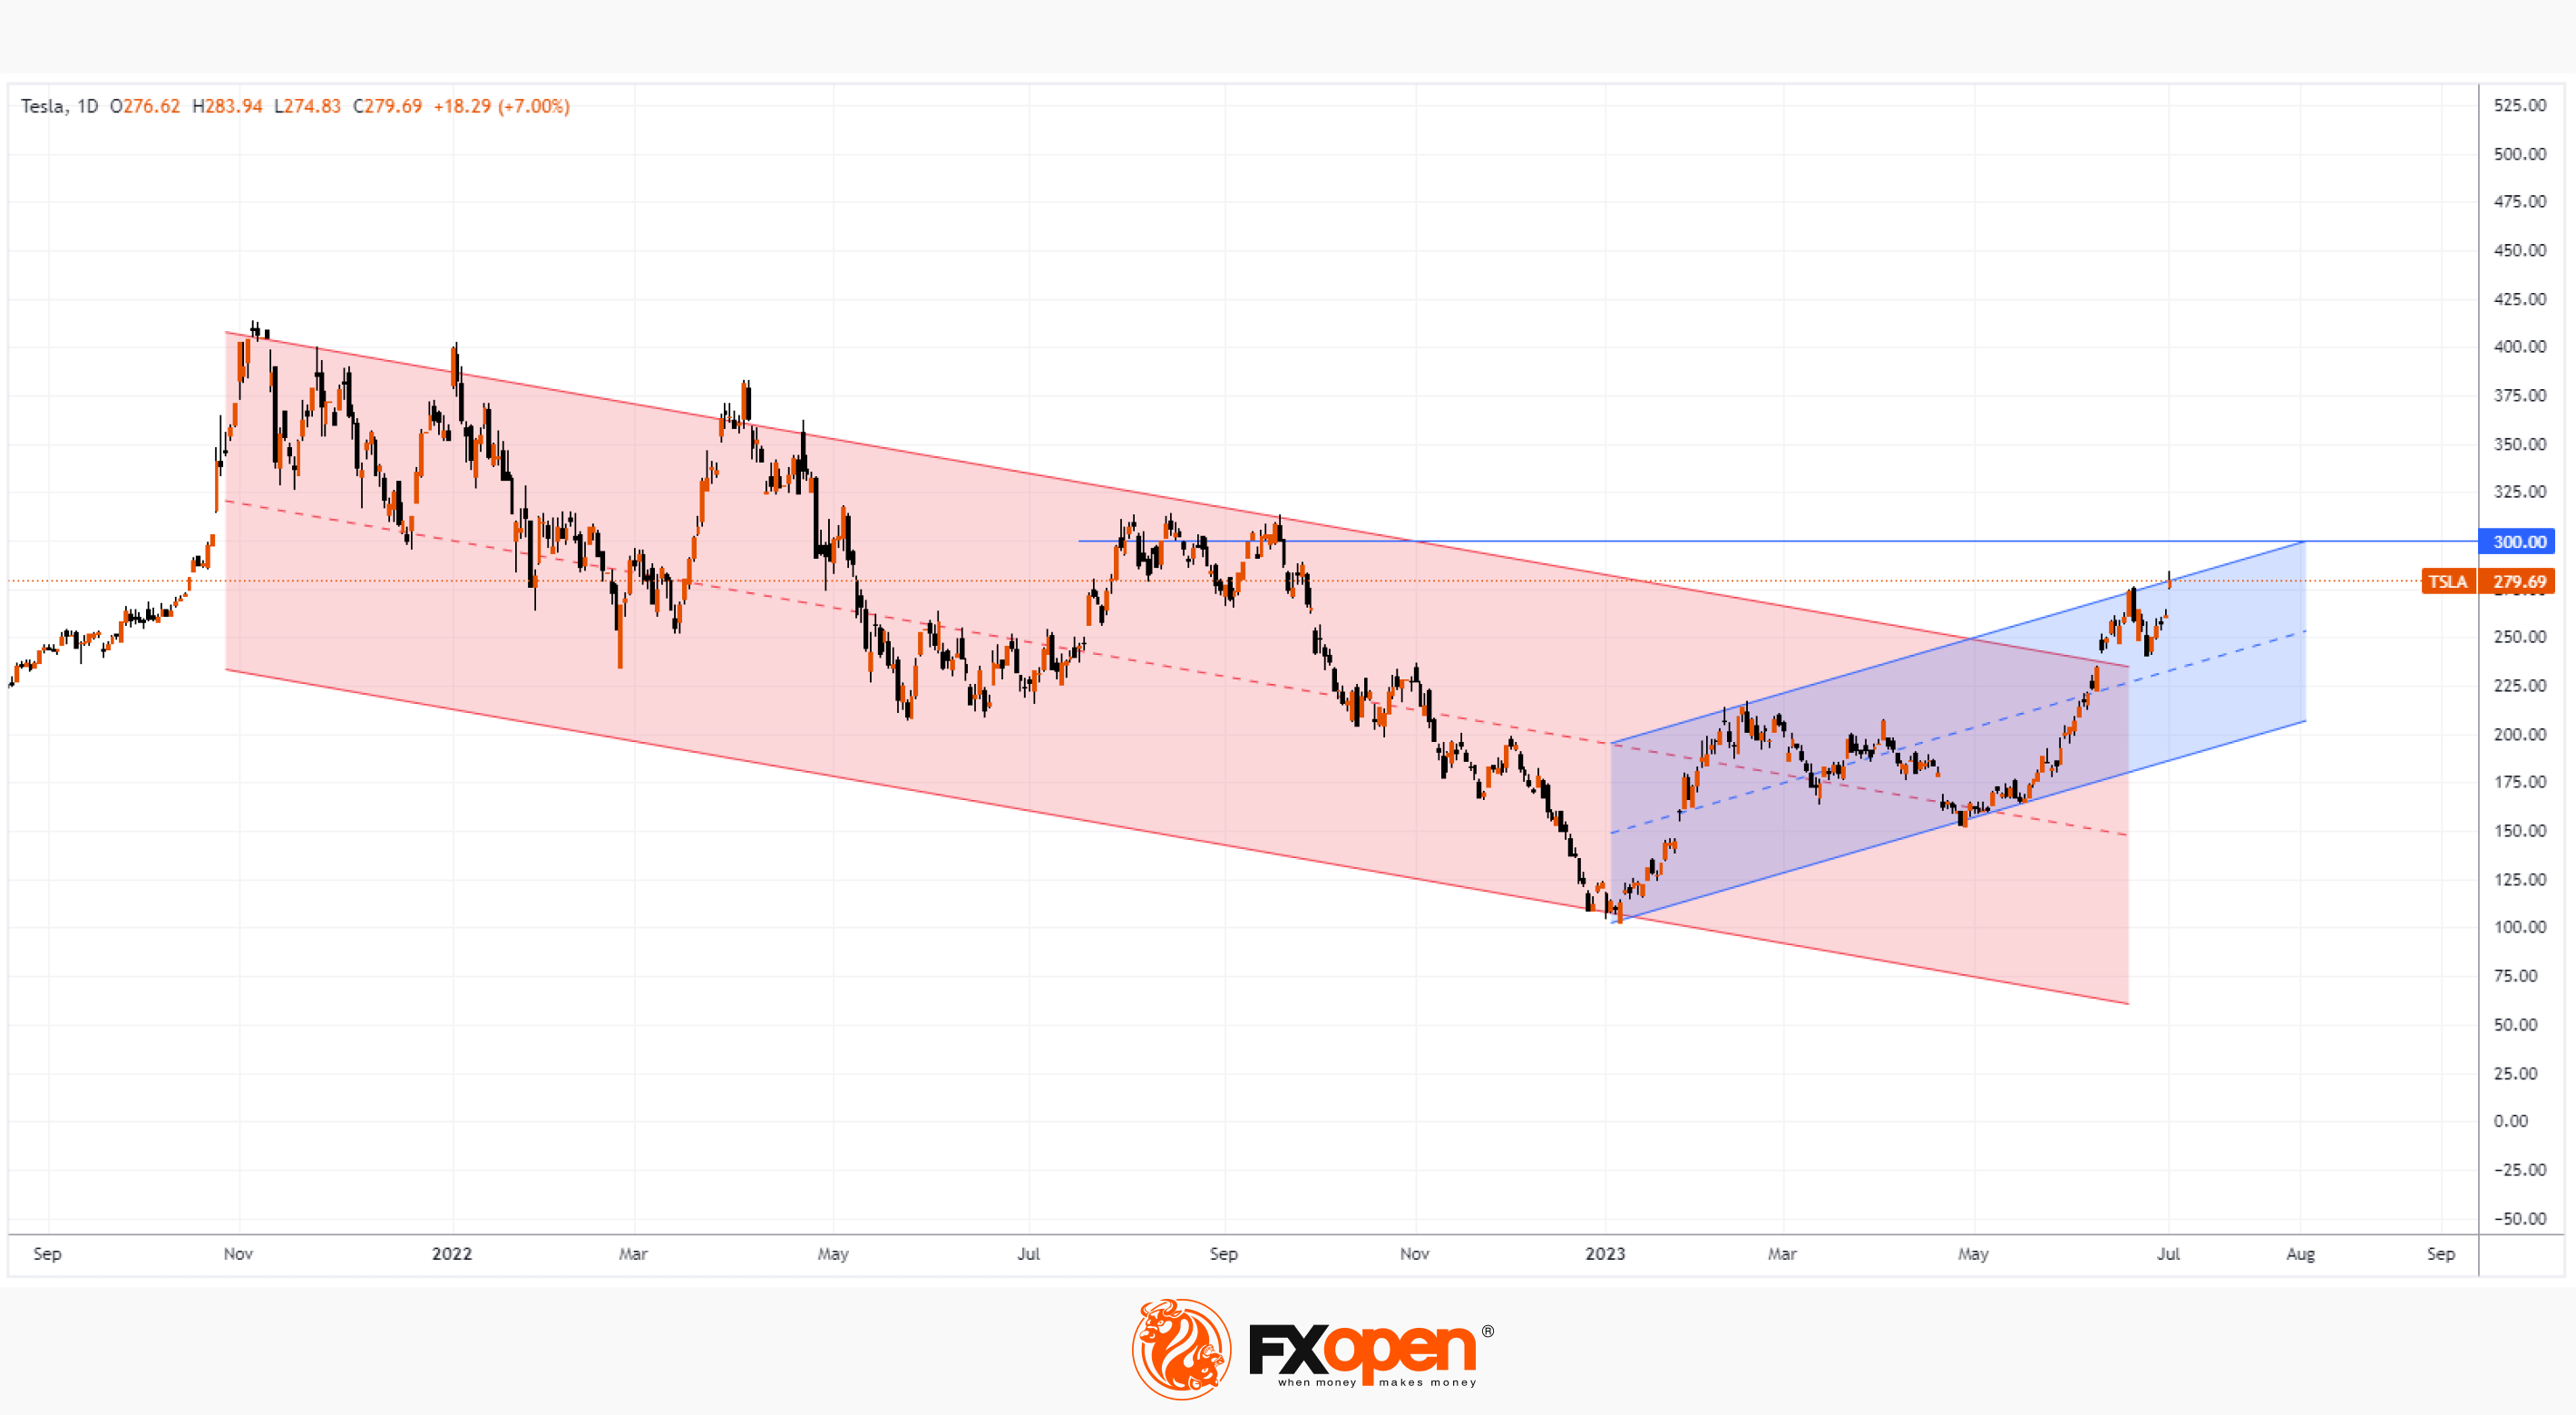
Meanwhile, the bull market continues, with TSLA's share price hitting a new high for the year after reporting record EV shipments in Q2. At the same time, the TSLA stock chart shows that:
→ the price of TSLA breaks through the descending channel with a gap (shown in red) and fixes above it within the ascending channel (shown in blue);
→ TSLA price is near the upper border of the rising channel, which is resisting;
→ TSLA price is approaching psychological resistance at USD 300 per share — last year it proved to be a test for bulls, showing their failure.
According to analysts published by CNNMoney, the average target price for TSLA shares is around USD 220.
Given the above, we can assume that the TSLA stock market is vulnerable to a pullback within the blue channel. But that's probably less likely to upset Musk more than his loss in a possible fight against Zuckerberg.
Buy and sell stocks of the world's biggest publicly-listed companies with CFDs on FXOpen’s trading platform. Open your FXOpen account now or learn more about trading share CFDs with FXOpen.
This article represents the opinion of the Companies operating under the FXOpen brand only. It is not to be construed as an offer, solicitation, or recommendation with respect to products and services provided by the Companies operating under the FXOpen brand, nor is it to be considered financial advice.
Stay ahead of the market!
Subscribe now to our mailing list and receive the latest market news and insights delivered directly to your inbox.


Latest articles

Weekly Market Insights with Gary Thomson: The Week of Central Banks and Earnings
In this video, we’ll explore the key economic events and market trends, shaping the financial landscape. Get ready for insights into financial markets to help you navigate the week ahead. Let’s dive in!
In this episode of Market

Intel at a Crossroads: Earnings Beat Meets Technical Resistance
Intel has just delivered its strongest quarter in over fifteen years, and the market reaction says it all. Q2 2026 revenue surged 25% year-over-year to $16.1 billion, crushing the consensus estimate of $14.42 billion, while adjusted EPS of

Tesla: Complex Range Structure Breaks Down Following Quarterly Earnings
Tesla released its Q2 2026 results after the market closed on 22 July. Revenue increased 26% year-on-year to $28.24 billion, while vehicle deliveries reached a record 480,126 units. However, operating margin fell sharply to 1.4%, down from