


TSLA Stock Price Falls Over 9% in Just 2 Days
FXOpen

The day before yesterday, trading in TSLA shares began at an opening price of USD 199.34; trading yesterday closed at a price of USD 180.51. The fall in TSLA shares led Musk to lose the title of the world's richest man to Jeff Bezos.
The main driver of the decline in the price of TSLA shares was news:
→ about the temporary shutdown of the Giga Berlin plant in Germany after an arson set by a group claiming that the company led by Elon Musk is devouring “land, resources, people”;
→ that deliveries of electric cars from the Shanghai plant have dropped to their lowest level in more than a year — which may indicate fierce competition with Chinese manufacturers.
It also became known that Morgan Stanley analyst Adam Jonas is lowering his target price from USD 345 to USD 320 and predicting a decline in sales for FY24.
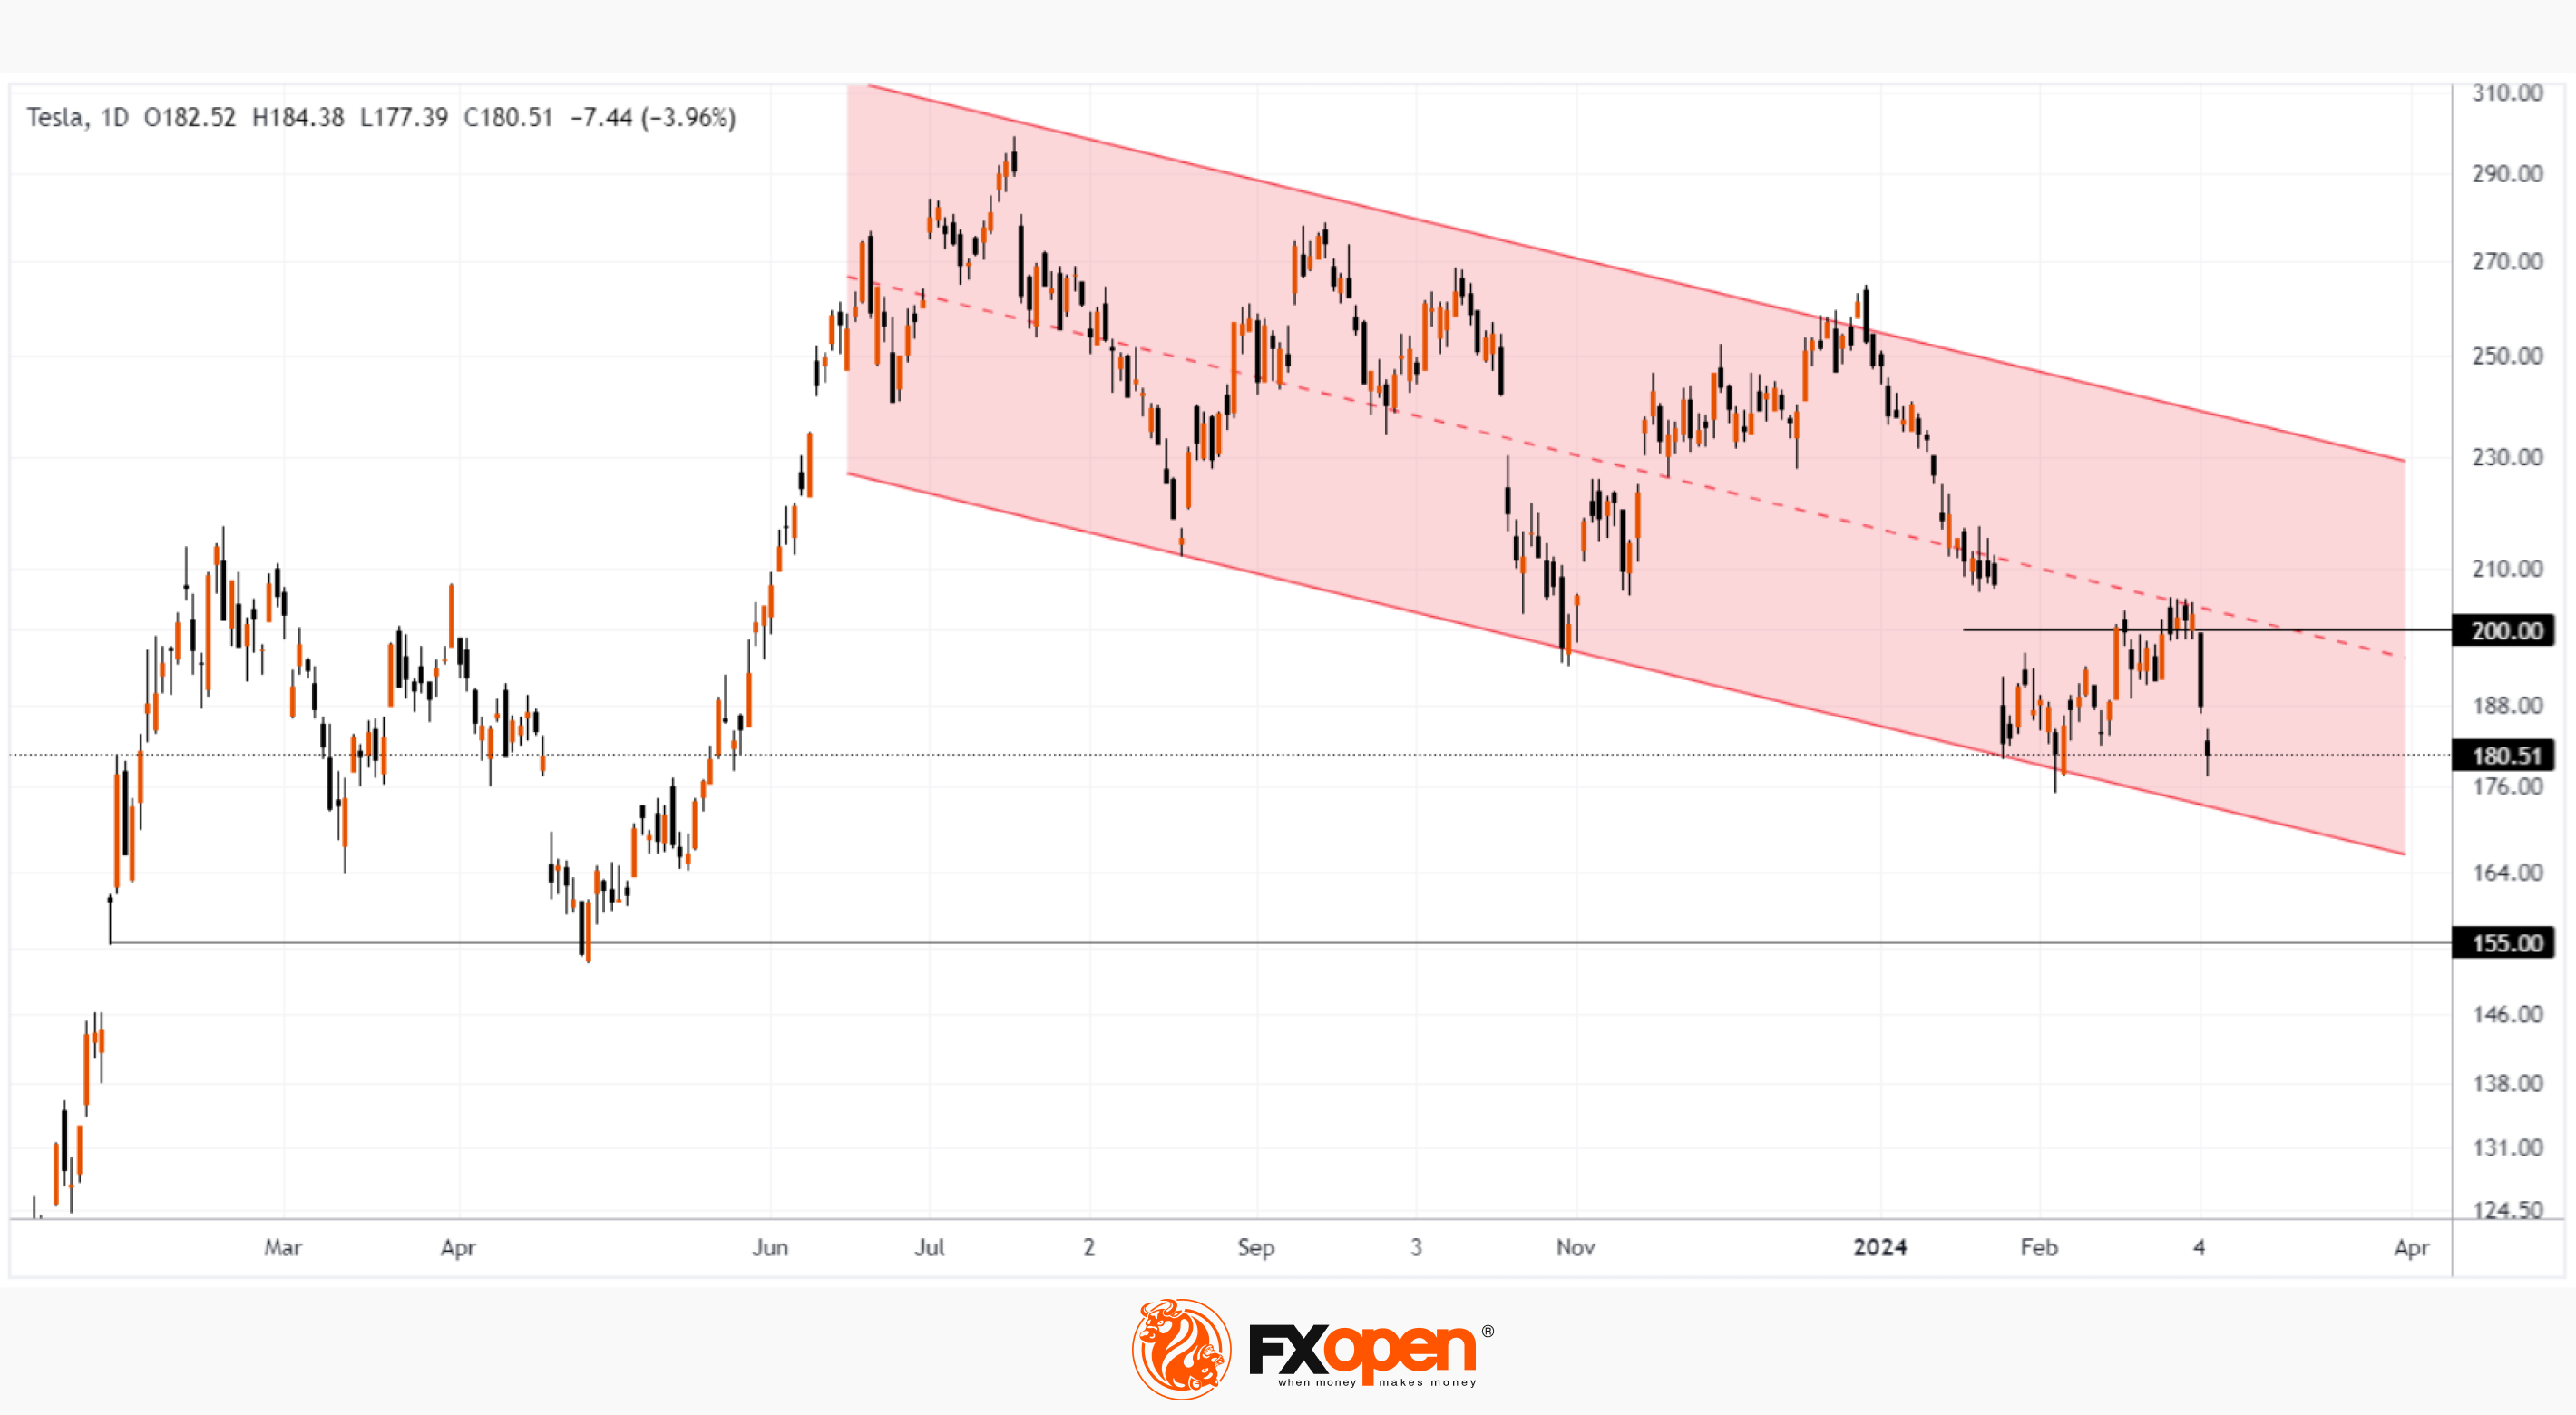
Technical analysis of the TSLA stock chart shows that:
→ The TSLA stock price is moving in a downward channel (shown in red), acting noticeably weaker than the broader market.
→ In March, the median line acted as resistance.
→ The price was unable to consolidate above the round level of USD 200 (in November last year it worked as support).
If the bearish momentum continues, TSLA price could reach the channel's lower boundary around USD 170, renewing its 2024 low. Even lower is important support at USD 155, formed from a gap last January and tested in April.
On the other hand, the current decline may turn into a profitable opportunity in the long term.
As it became known this week, Cathie Wood's ARK funds are increasing their long positions in TSLA shares. And respected analyst Daniel Ives said on CNBC that Tesla's growth story isn't dead and it's just going through a "brutal transition" that could be linked to deteriorating communication due to the company replacing its chief financial officer last year.
Buy and sell stocks of the world's biggest publicly-listed companies with CFDs on FXOpen’s trading platform. Open your FXOpen account now or learn more about trading share CFDs with FXOpen.
This article represents the opinion of the Companies operating under the FXOpen brand only. It is not to be construed as an offer, solicitation, or recommendation with respect to products and services provided by the Companies operating under the FXOpen brand, nor is it to be considered financial advice.
Stay ahead of the market!
Subscribe now to our mailing list and receive the latest market news and insights delivered directly to your inbox.


Latest articles

Ethereum: Has the Recovery Begun?
Ethereum has staged a notable rebound after once again testing the heavily watched psychological zone around 1500$. Since bouncing off this support, ETH/USD has climbed roughly 13%, now trading around the $1,700 mark.
This recovery is being driven

Oil Prices Are Back at Pre-Conflict Levels. Analysts Are Divided
At the start of May, oil markets were still pricing in elevated geopolitical risk and expectations of sustained supply disruption.
But easing tensions between Washington and Tehran, along with improving supply expectations, have rapidly shifted sentiment back toward fundamentals.
📉 Brent

The Dollar Awaits the Week’s Key Report: AUD/USD and NZD/USD at Crucial Technical Levels
Following mixed performance by the US dollar earlier this week, investors are now fully focused on the June Nonfarm Payrolls report, which will be released on Thursday rather than Friday. The schedule has been brought forward as US financial markets