


FXOpen

The Tesla (TSLA) stock chart today shows that the price surged by more than 6% during yesterday’s trading session, driven by a strong retail sales report released the same day.
According to ForexFactory, analysts had expected Retail Sales to increase by 0.4% month-on-month. However, the actual data showed a 1.0% rise (for comparison, previous figures indicated a decline of -0.2%).
It seems that market participants interpreted this as a sign that Tesla's sales could also rise, propelling the electric vehicle manufacturer's stock to one of the top performers.
Technical analysis of Tesla (TSLA) chart today shows:
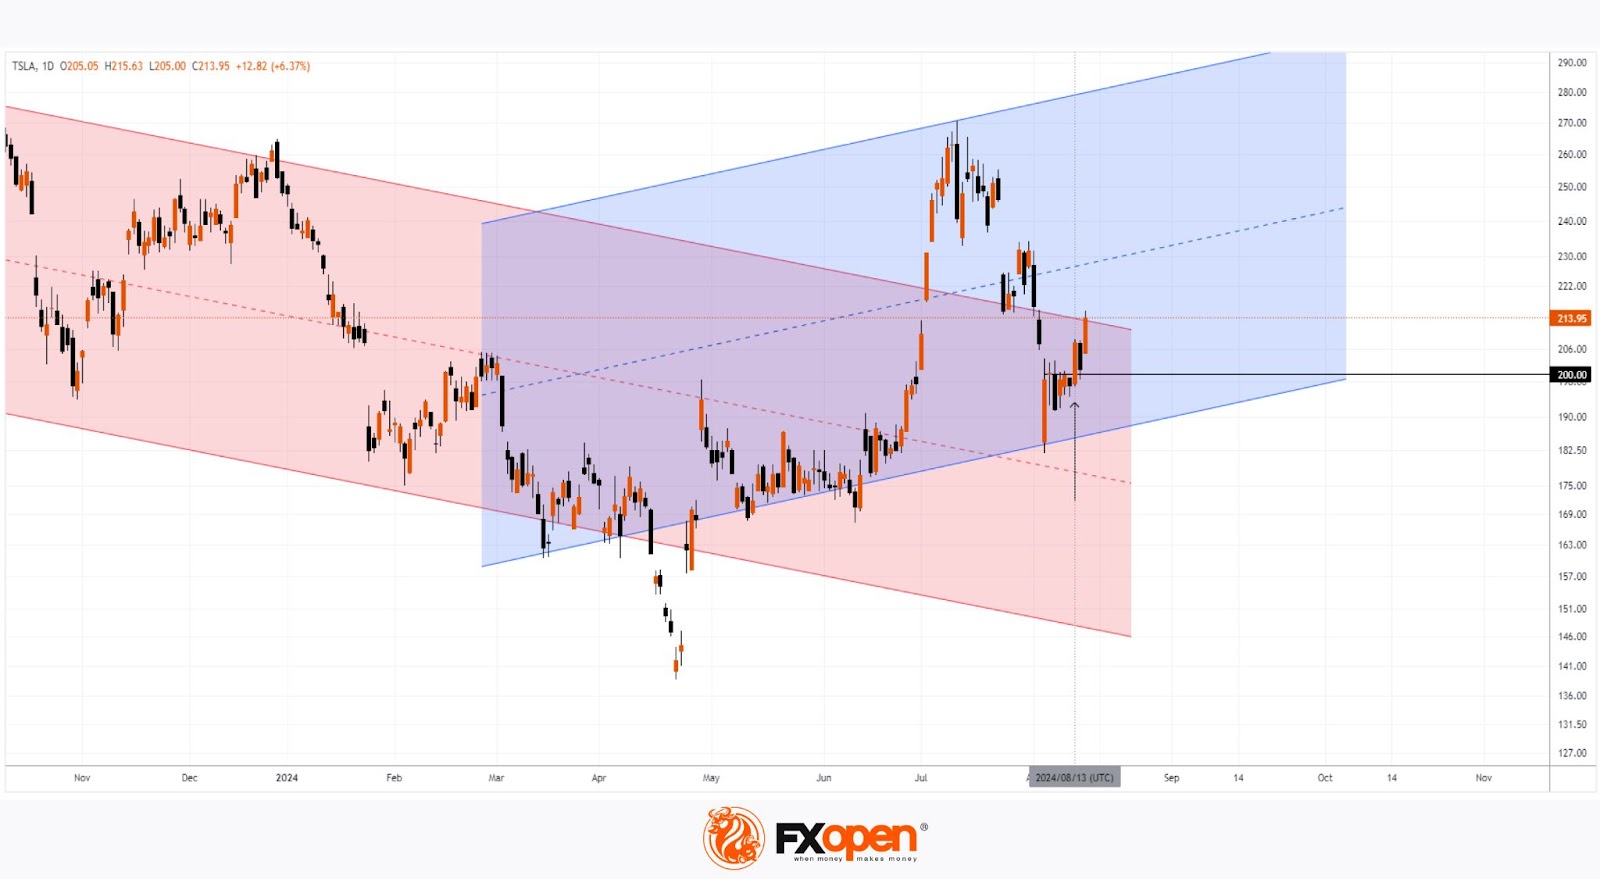
→ Amidst the broader market decline caused by recession fears that peaked on August 5, the price returned to the red descending channel. However, yesterday's movement pushed the price towards its upper boundary.
→ Bulls may break through the upper boundary of this channel and push the price into an ascending channel (shown in blue) for Tesla (TSLA) shares.
→ The strength of the bulls can be gauged by the price action around the psychological level of $200. If this level acted as resistance after August 5, its role changed on August 13 (as indicated by the arrow). The price made a bullish breakout, followed by a successful test the next day.
If events unfold positively, the $200 level could become the launchpad for a significant rally in Tesla (TSLA) shares.
According to the average opinion of analysts surveyed by TipRanks, the 12-month price target for Tesla (TSLA) shares is $211.46, indicating cautious optimism.
Buy and sell stocks of the world's biggest publicly-listed companies with CFDs on FXOpen’s trading platform. Open your FXOpen account now or learn more about trading share CFDs with FXOpen.
This article represents the opinion of the Companies operating under the FXOpen brand only. It is not to be construed as an offer, solicitation, or recommendation with respect to products and services provided by the Companies operating under the FXOpen brand, nor is it to be considered financial advice.
Stay ahead of the market!
Subscribe now to our mailing list and receive the latest market news and insights delivered directly to your inbox.


Latest articles

European Currencies Decline: Pound Hits New Lows, Euro Under Pressure
European currencies continue to weaken against the US dollar amid rising geopolitical tensions and increased demand for safe-haven and liquid assets. Market participants are reducing exposure to riskier instruments, putting pressure on both the euro and the pound. Additional support

Market Analysis: GBP/USD Dips Further As EUR/GBP Regains Traction
GBP/USD failed to climb above 1.3500 and corrected some gains. EUR/GBP started a decent increase and might aim for more gains above 0.8700.
Important Takeaways for GBP/USD and EUR/GBP Analysis Today
· The British Pound
