


FXOpen

September is likely to be the second month in a row that the Dow Jones (US 30) stock market index declined. The last time this happened was... also in September, a year ago.
Important economic data was published yesterday:
→ According to a revised report released by the Bureau of Economic Analysis, US real GDP increased 2.1% year over year in the second quarter. This reduces the risk of recession.
→ The number of applications for unemployment benefits amounted to 204k for a week, which continues the downward trend that has emerged since June of this year.
Today, fresh data on the PCE inflation index will be published, it can provide evidence that inflation is slowly subsiding as long as the economy remains resilient.
More bullish arguments for displaying cautious optimism are provided by the Dow Jones index chart:
→ the price of US 30 has formed an inverted head-and-shoulders pattern (SHS);
→ this bullish pattern formed near the lower border of the descending channel — which indicates support from this line;
→ after Wednesday, when the bearish acceleration was noticeable, the price recovered — this is a sign that if there were panic sentiments, they have exhausted themselves.
→ On Thursday, the bears’ attempts to resume the decline failed, and Friday morning looks optimistic – during the Asian session the price exceeded Thursday’s high.
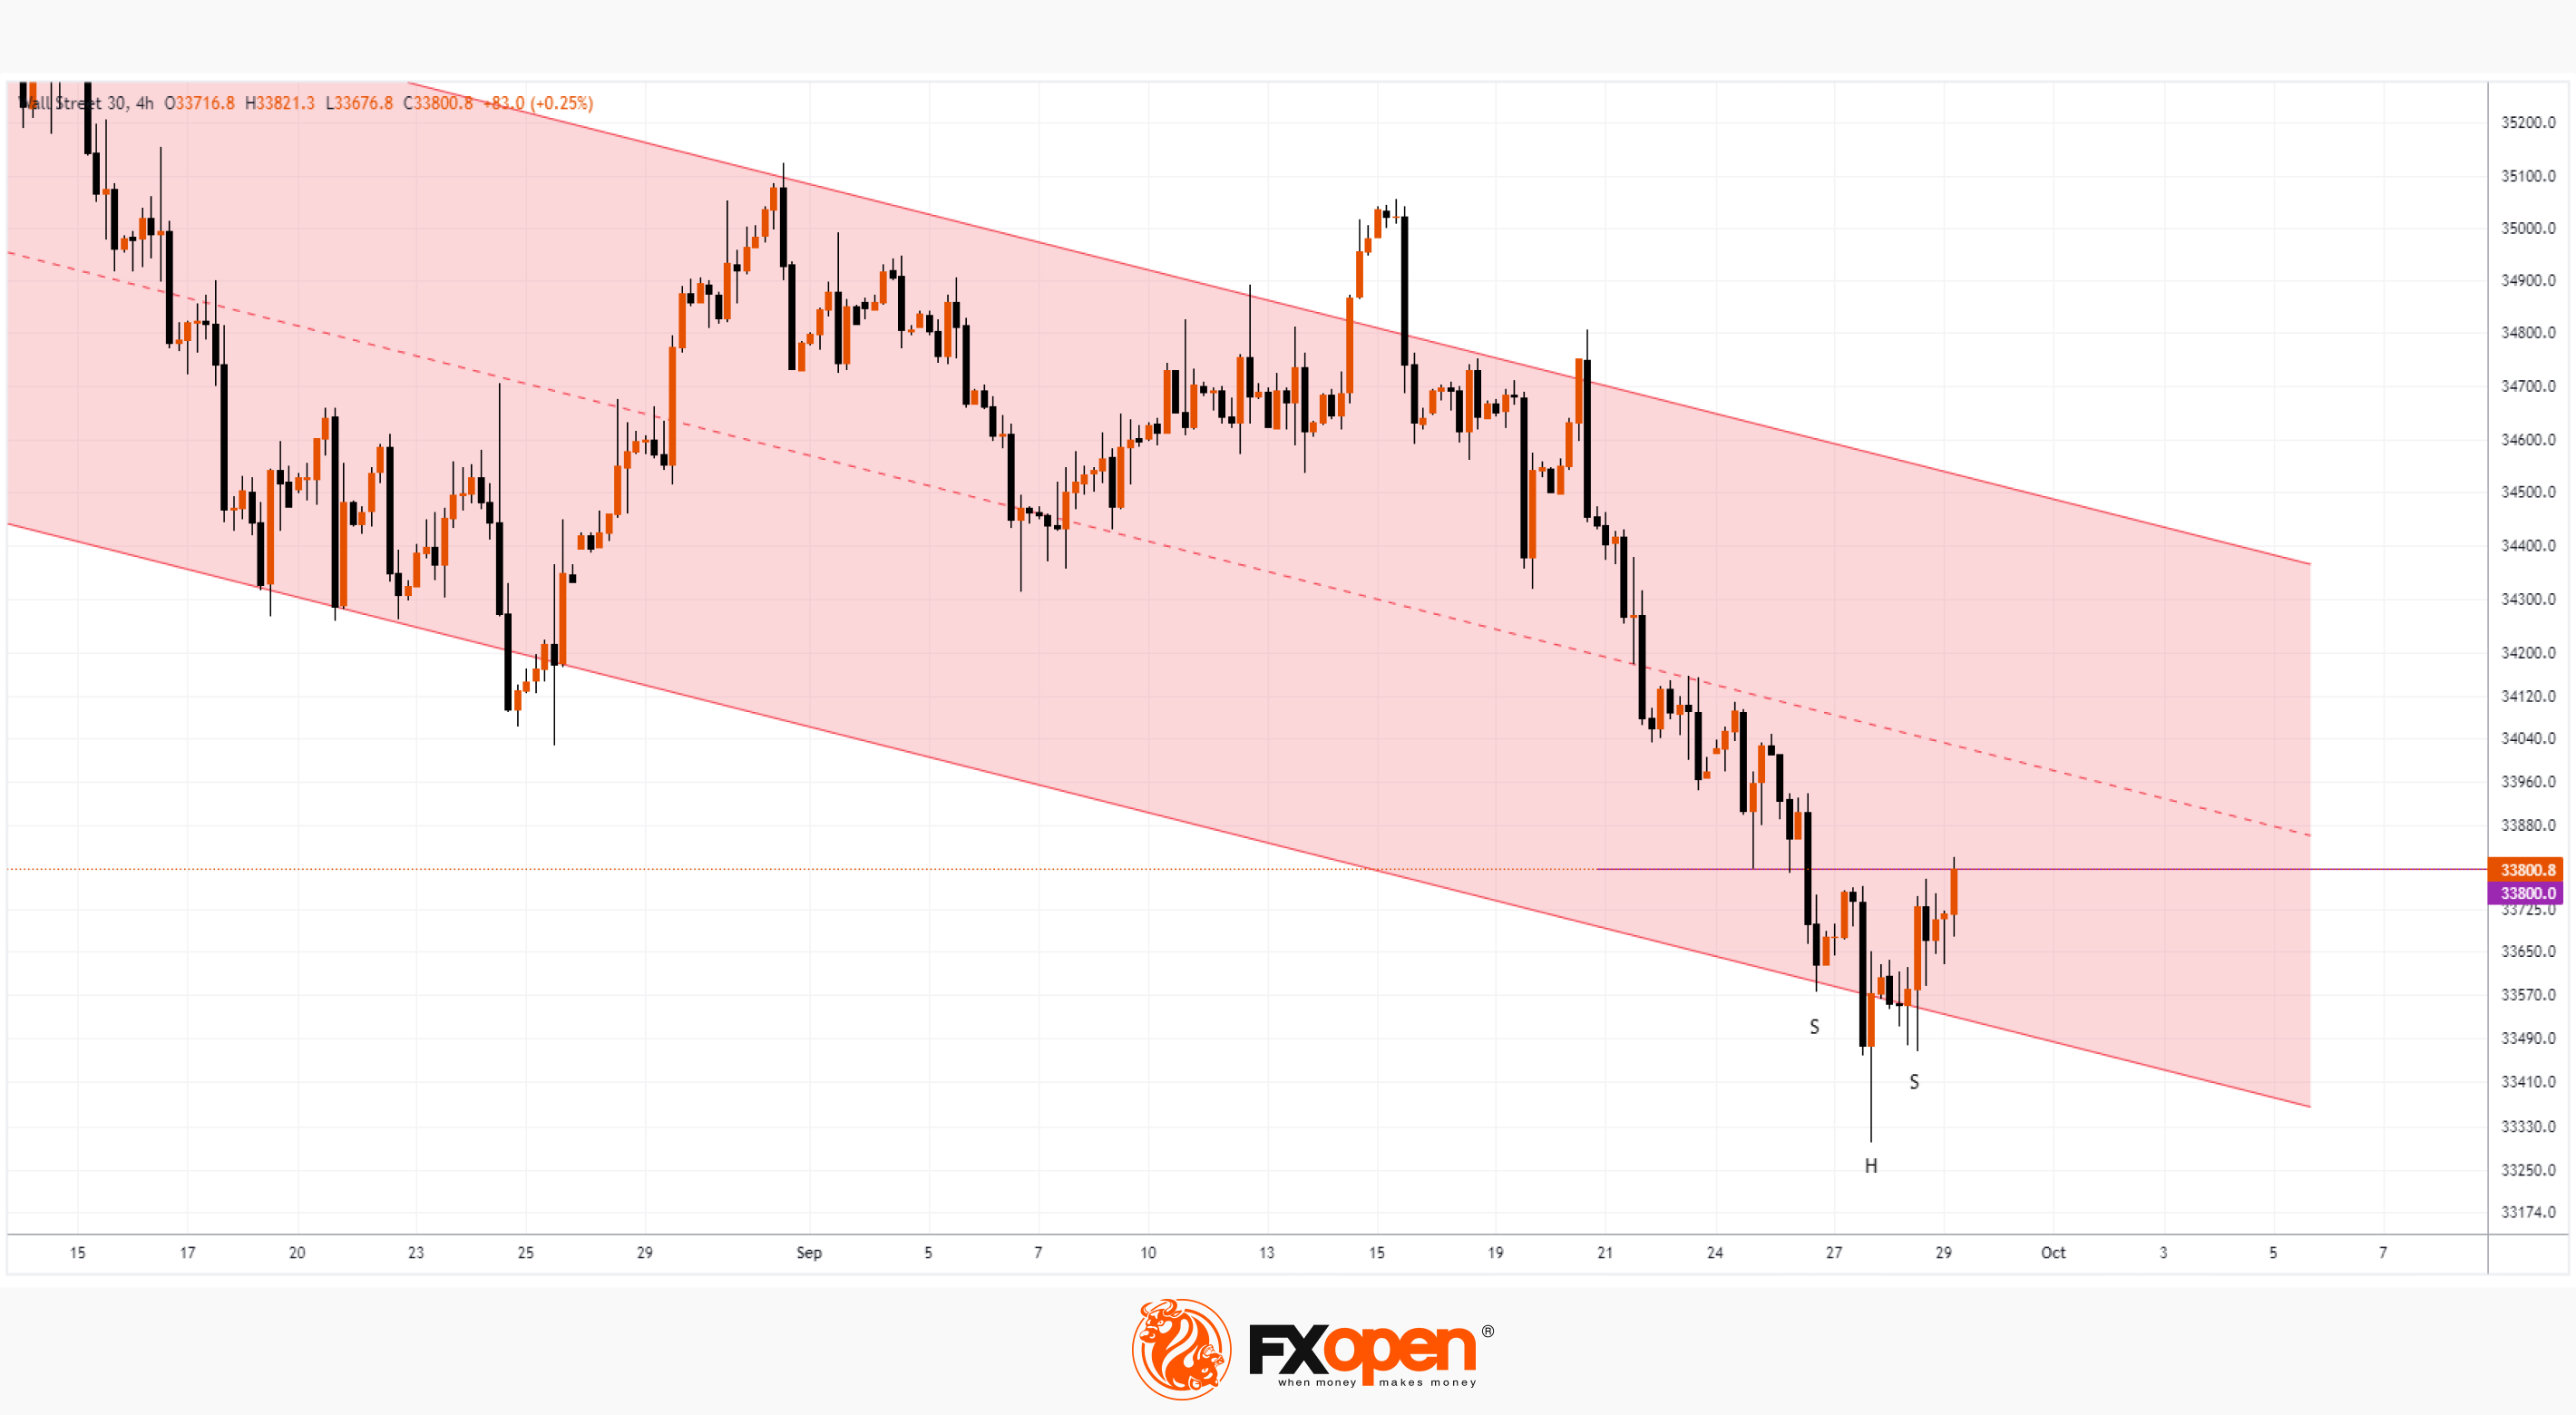
The market will receive more bullish arguments if the price can consolidate above the resistance of 33,800, which is the neck line of SHS.
Perhaps the tone for the rally is being set by insiders who have information that the risk of a government shutdown in the US is being minimized. If the emerging optimism continues for a longer period of time, then October will be able to interrupt the pattern of 2 bearish candles on the monthly chart, as was the case last year.
Trade global index CFDs with zero commission and tight spreads (additional fees may apply). Open your FXOpen account now or learn more about trading index CFDs with FXOpen.
This article represents the opinion of the Companies operating under the FXOpen brand only. It is not to be construed as an offer, solicitation, or recommendation with respect to products and services provided by the Companies operating under the FXOpen brand, nor is it to be considered financial advice.
Stay ahead of the market!
Subscribe now to our mailing list and receive the latest market news and insights delivered directly to your inbox.


Latest articles

USD/CAD Rises to a Two-Month High
Today, the USD/CAD currency pair climbed above the 1.3787 level for the first time since late January.
→ Demand for the US dollar is being supported by concerns over escalating tensions in the Middle East. Market participants are favouring

Alphabet (GOOGL) Shares Fall to 2026 Low
As the chart shows, Alphabet (GOOGL) shares have dropped to their lowest level of 2026, with trading closing well below the psychological $300 per share mark.
Why Have Alphabet (GOOGL) Shares Declined?
The bearish move is driven by a combination

FX Market Awaits Macro Data: EUR/USD and GBP/USD Near Range Boundaries
European currencies are trading without a clear direction against the US dollar, remaining in a consolidation phase following the earlier decline driven by USD strength. At the start of the week, both EUR/USD and GBP/USD attempted a recovery,