


USD/CAD Analysis: Bank of Canada Cuts Interest Rate by 0.25%
FXOpen

This occurred yesterday and was in line with analysts' forecasts, according to a Bloomberg survey.
According to statements from the Bank of Canada:
→ Price growth indicators for consumer price index components have further decreased and are close to their historical average;
→ Recent data has increased confidence that inflation will continue moving towards the 2% target;
→ Monetary policy no longer needs to be as restrictive.
At the press conference, Governor Tiff Macklem stated that there is “compelling evidence” of weakening inflation and it is “reasonable to expect” further rate cuts if inflation continues to slow.
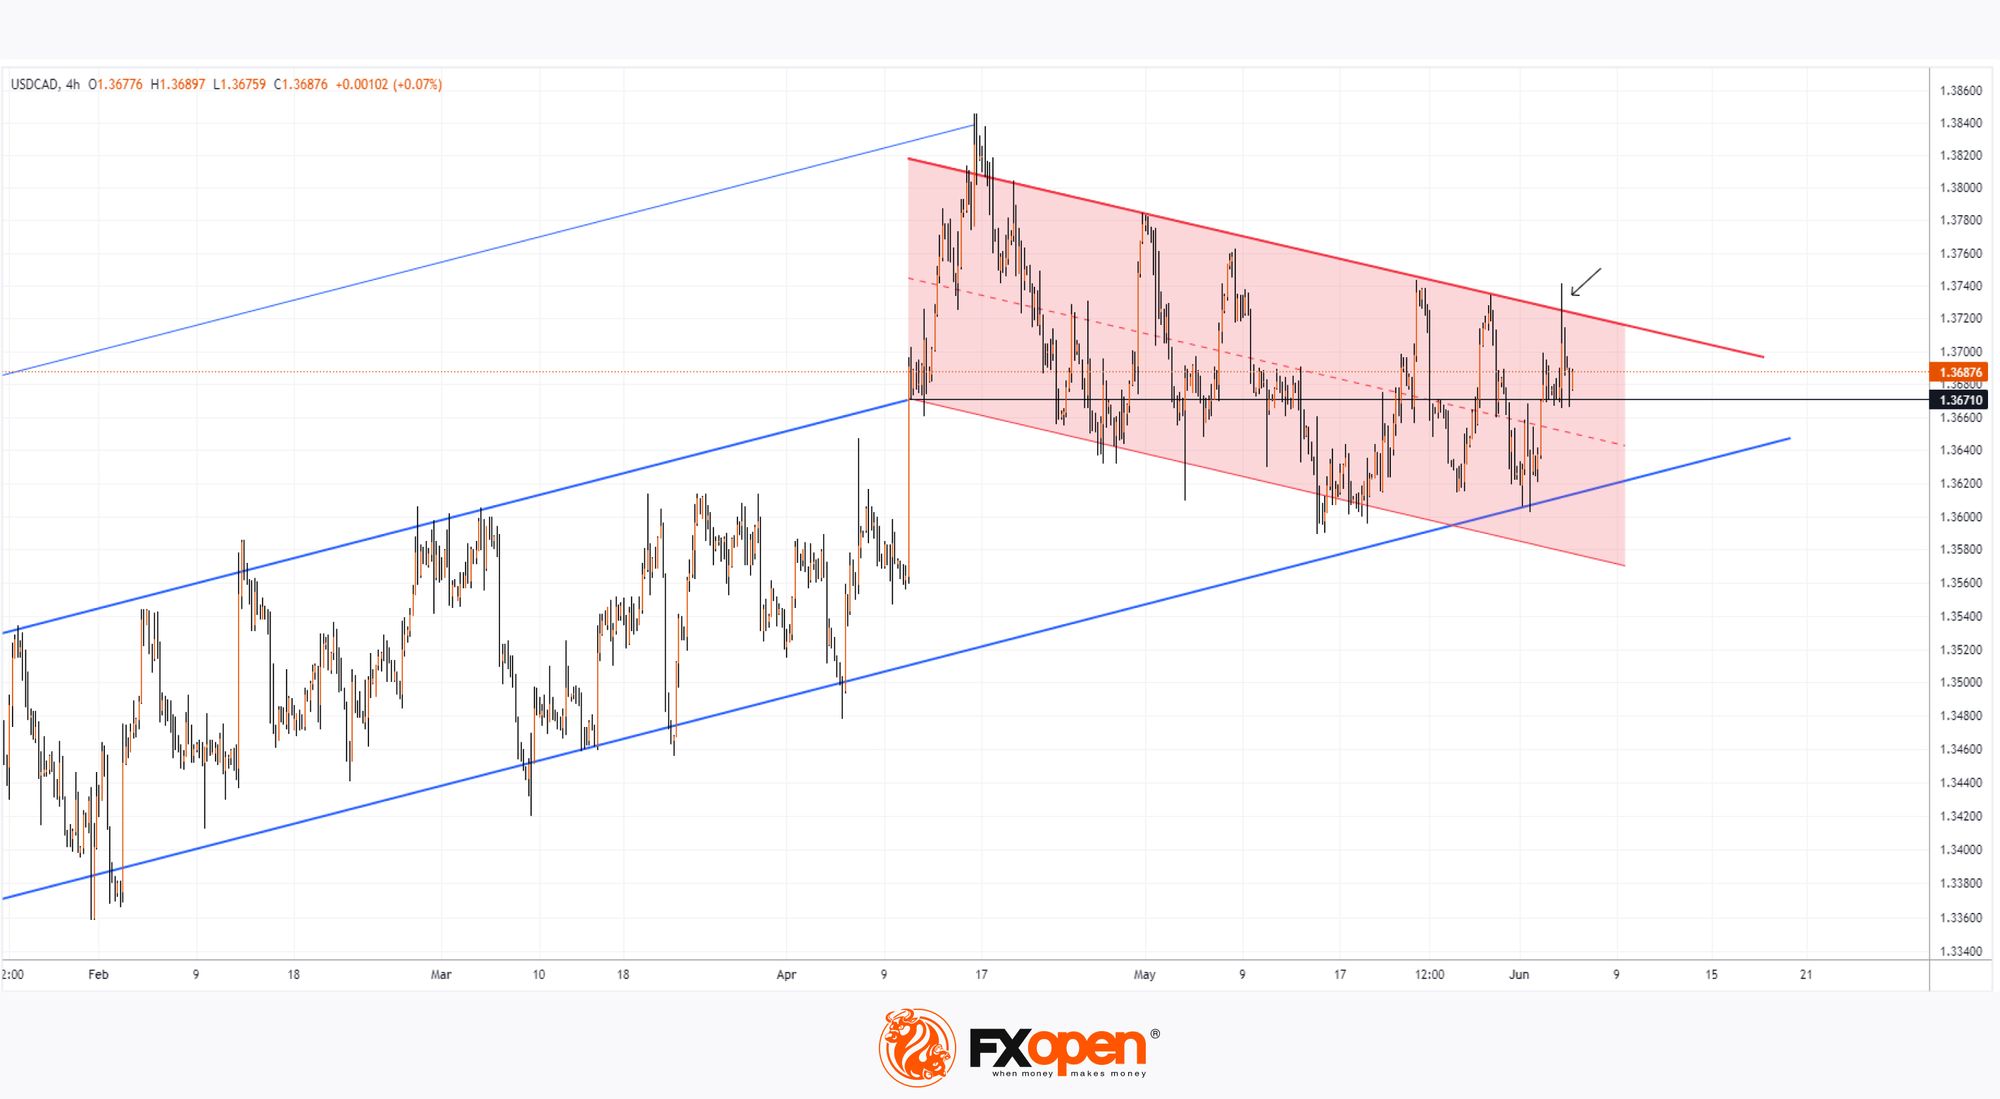
Technical analysis of the USD/CAD chart:
→ Since mid-April, the market has been in a downtrend (indicated by red lines);
→ Simultaneously, a longer-term uptrend is shown by the blue channel;
→ Overall, the price is being squeezed into a symmetrical triangle between the upper red and lower blue lines, with the axis around the 1.3671 level acting as a "magnet," indicating a stable balance of supply and demand. Yesterday’s news caused a spike in volatility, with the USD/CAD price attempting to break the upper boundary, but the breakout was false (indicated by an arrow), and the price returned to the axis where it was before the announcement.
Thus, it can be concluded that the market had anticipated the rate cut, and it was not a surprise. This means that fluctuations within the triangle may continue until a fundamental event occurs that can lead to a breakout of this consolidation pattern in technical analysis.
Analysts at Think.ING predict a possible decline in the USD/CAD rate to the 1.35 level in the second half of 2024.
Trade over 50 forex markets 24 hours a day with FXOpen. Take advantage of low commissions, deep liquidity, and spreads from 0.0 pips (additional fees may apply). Open your FXOpen account now or learn more about trading forex with FXOpen.
This article represents the opinion of the Companies operating under the FXOpen brand only. It is not to be construed as an offer, solicitation, or recommendation with respect to products and services provided by the Companies operating under the FXOpen brand, nor is it to be considered financial advice.
Stay ahead of the market!
Subscribe now to our mailing list and receive the latest market news and insights delivered directly to your inbox.


Latest articles

AI Valuations Are Back in the Spotlight
Artificial intelligence remains the dominant investment theme of 2026, but investors are increasingly questioning whether AI stock valuations are keeping pace with reality.
💰 Big Tech continues to invest at an unprecedented scale, with hyperscaler AI spending projected to exceed $800

AUD/CAD: Months of Indecision — Is a Breakout Finally Coming?
The Australian dollar has clawed back most of its end-of-June losses, when it touched three-month lows against the greenback amid escalating Middle East tensions. Since then, sentiment has improved: the RBA's Assistant Governor Sarah Hunter signalled the board stands ready

USD/JPY: Battling at the Top of the Triangle
On 3 July, Japan's Finance Minister, Satsuki Katayama, stated that the Ministry of Finance remains in close contact with US authorities regarding developments in USD/JPY as the yen traded near its weakest level in almost 40 years. Similar verbal