


USD/CAD Analysis: Canadian Dollar Strengthens Ahead of Inflation News
FXOpen

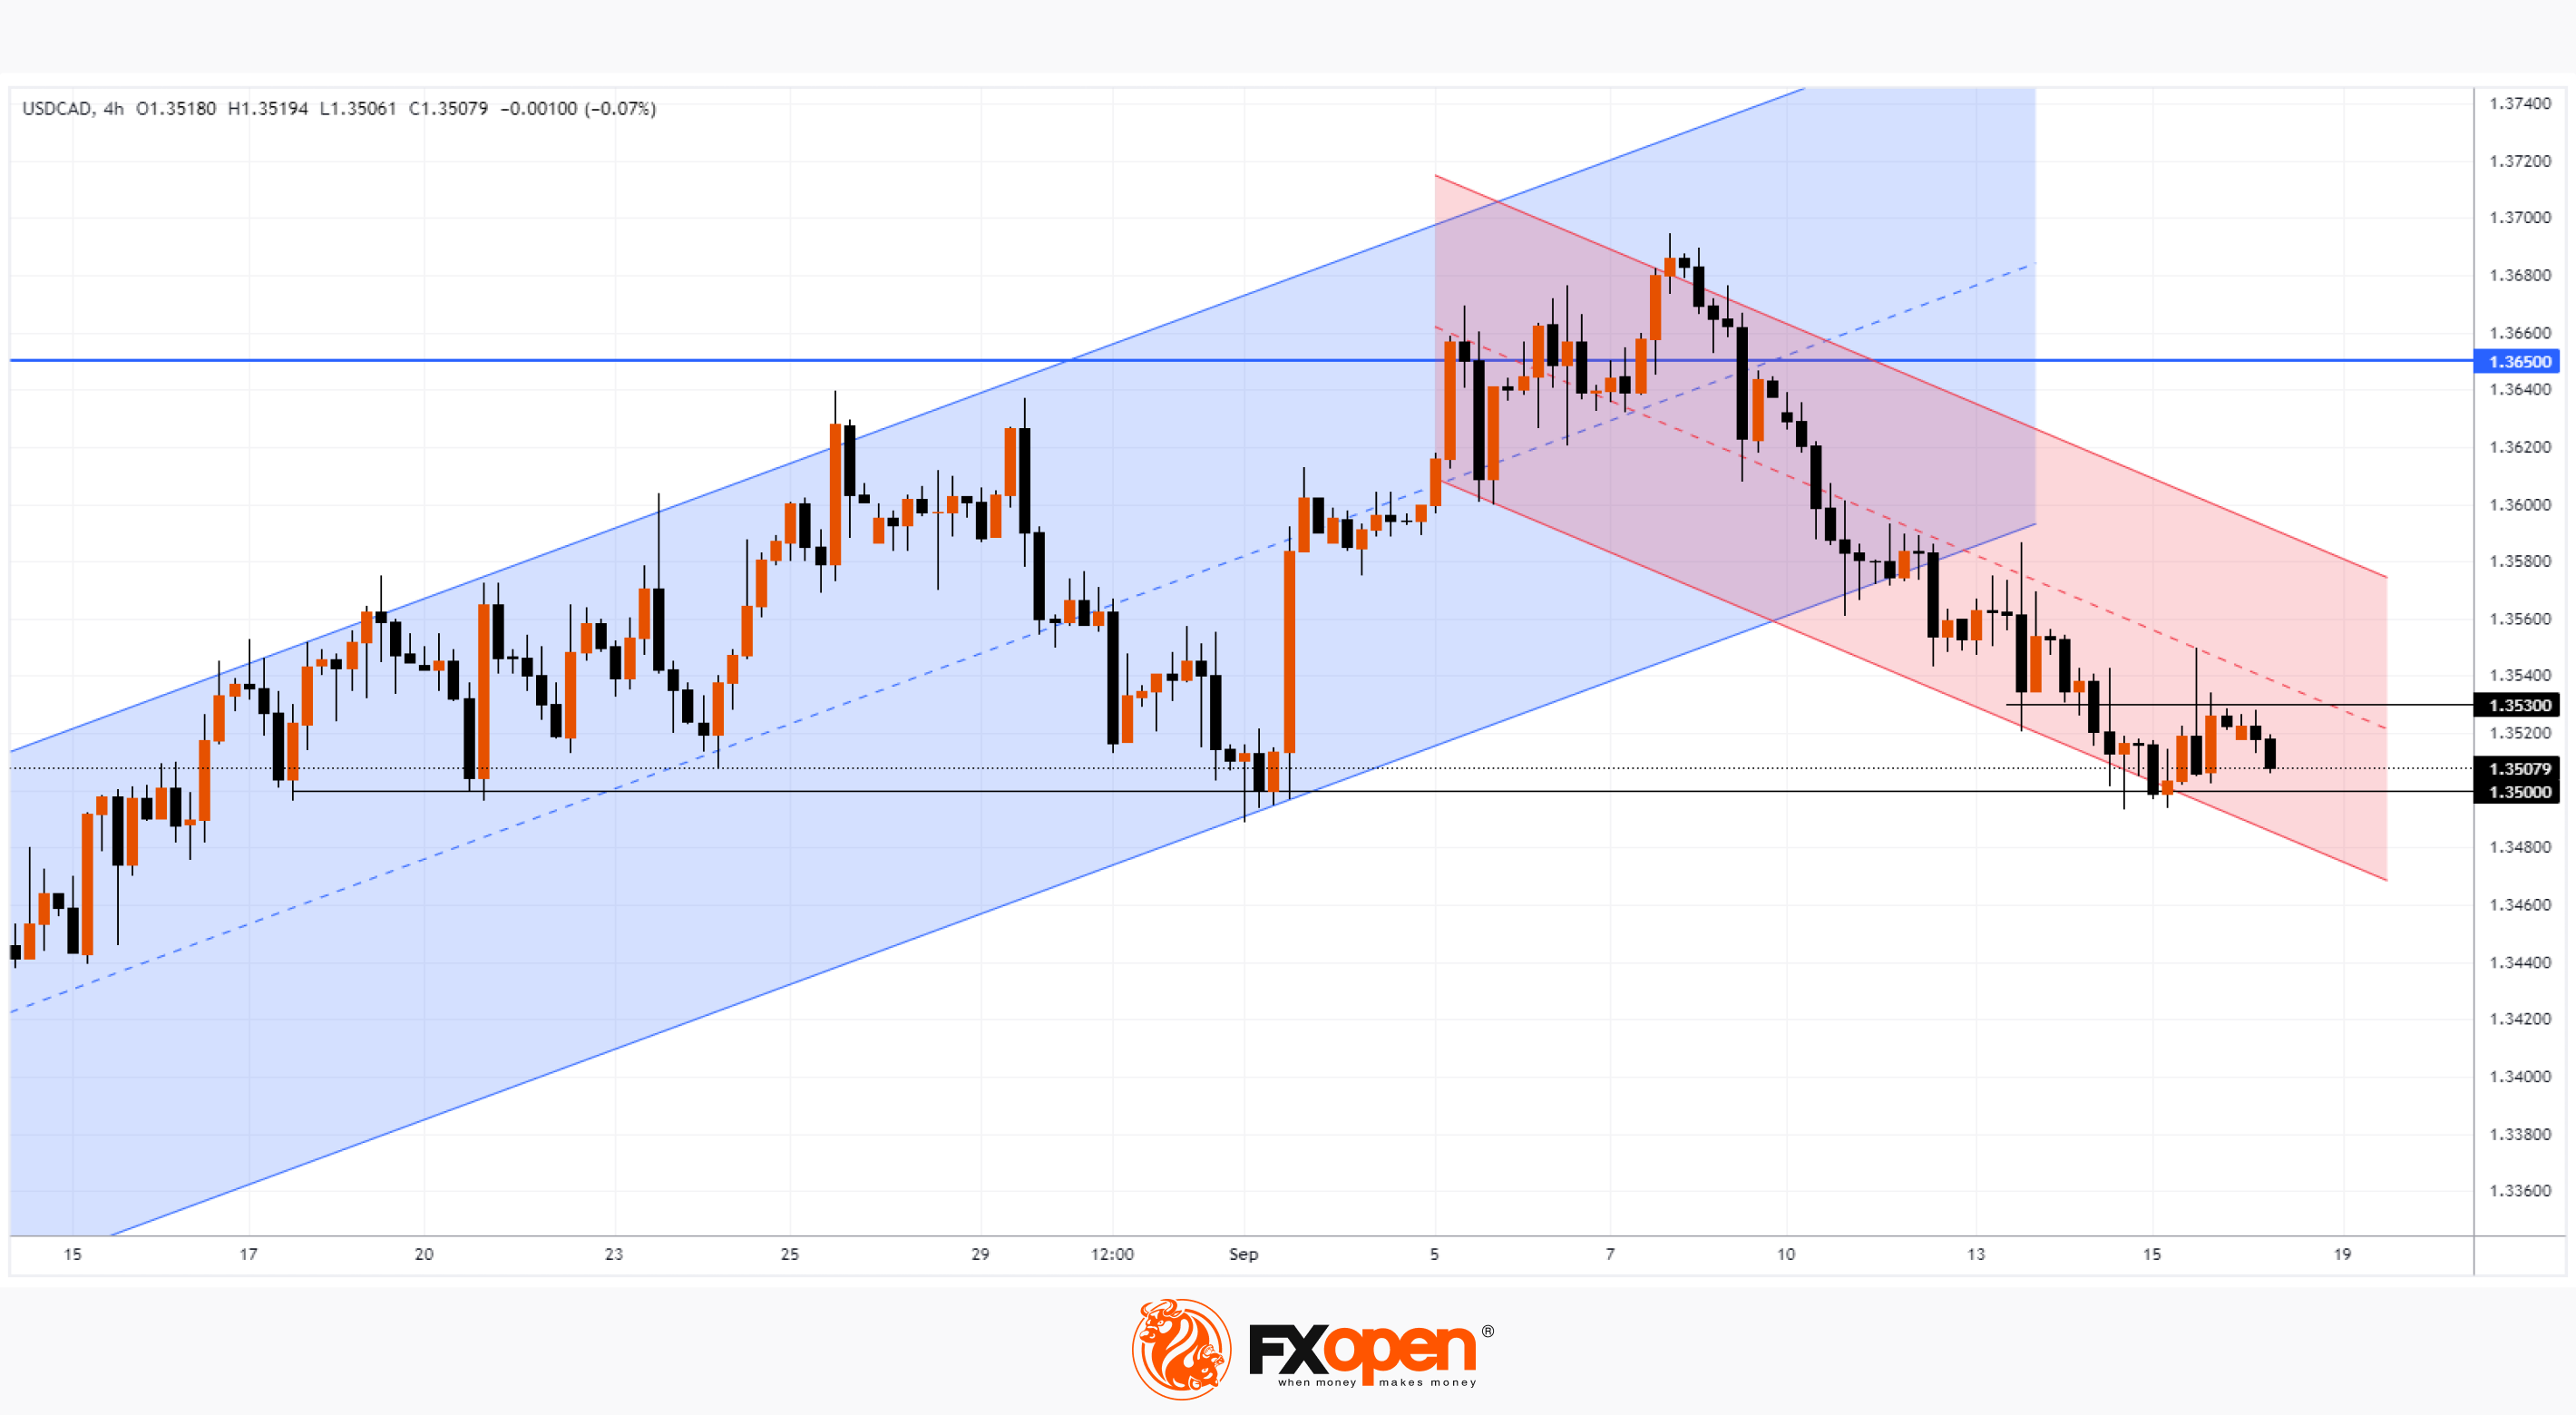
On September 7, we wrote that the level of 1.365 could serve as resistance, from which the price will form a bearish reversal.
As the USD/CAD chart shows, the rate dropped from this resistance to the psychological level of 1.3500, which served as support.
Wherein:
→ The bullish trend (shown by the blue channel) is broken. Facing resistance at 1.365, the bulls failed to reach the upper boundary of the channel, which was a sign of weakening uptrend. One could also observe bearish divergences on a number of indicators.
→ The price at the beginning of the week is in a downward trend, which is shown by the red channel.
→ The price formed a rebound from the psychological level of 1.3500 at the end of last week, but the momentum on the rebound quickly faded. And a return to support at 1.35 means the inability of the bulls to seize the initiative and the unrelenting pressure of the bears.
→ Level 1.353, which served as local support, now resists price growth. The long upper shadow on the September 15 candle confirms bearish pressure.
Thus, support 1.35 is in danger of being broken. And perhaps a successful bear attack will occur tomorrow at 15:30 GMT+3, when news on inflation in Canada will be published. It is expected to remain at 3.7%, however, given the significant increase in energy prices in August, surprises may occur that will affect the current balance of supply and demand in the USD/CAD market.
Trade over 50 forex markets 24 hours a day with FXOpen. Take advantage of low commissions, deep liquidity, and spreads from 0.0 pips (additional fees may apply). Open your FXOpen account now or learn more about trading forex with FXOpen.
This article represents the opinion of the Companies operating under the FXOpen brand only. It is not to be construed as an offer, solicitation, or recommendation with respect to products and services provided by the Companies operating under the FXOpen brand, nor is it to be considered financial advice.
Stay ahead of the market!
Subscribe now to our mailing list and receive the latest market news and insights delivered directly to your inbox.


Latest articles

AI Valuations Are Back in the Spotlight
Artificial intelligence remains the dominant investment theme of 2026, but investors are increasingly questioning whether AI stock valuations are keeping pace with reality.
💰 Big Tech continues to invest at an unprecedented scale, with hyperscaler AI spending projected to exceed $800

AUD/CAD: Months of Indecision — Is a Breakout Finally Coming?
The Australian dollar has clawed back most of its end-of-June losses, when it touched three-month lows against the greenback amid escalating Middle East tensions. Since then, sentiment has improved: the RBA's Assistant Governor Sarah Hunter signalled the board stands ready

USD/JPY: Battling at the Top of the Triangle
On 3 July, Japan's Finance Minister, Satsuki Katayama, stated that the Ministry of Finance remains in close contact with US authorities regarding developments in USD/JPY as the yen traded near its weakest level in almost 40 years. Similar verbal