


USD/CAD Analysis: Rate Reaches Its Minimum in 4 Months
FXOpen

On Friday, the rate dropped below 1.366 for the first time since the beginning of August. This was facilitated by fundamental drivers:
→ The US dollar weakens after the Federal Reserve meeting, which signaled the possibility of lowering interest rates next year. Powell said monetary tightening is likely complete and discussions about cuts are "on the horizon."
→ On the contrary, the Bank of Canada remains more hawkish. In a speech on Friday, its chief Tiff Macklem said it was too early to consider cutting interest rates as inflation remained stubbornly above target.
Also, the weakening of the US dollar could have been influenced by disappointing news about Flash Manufacturing PMI values in the US: actual = 48.2, expectations = 49.5, a month earlier = 49.4.
We wrote about bearish signs on the chart back on December 1st.
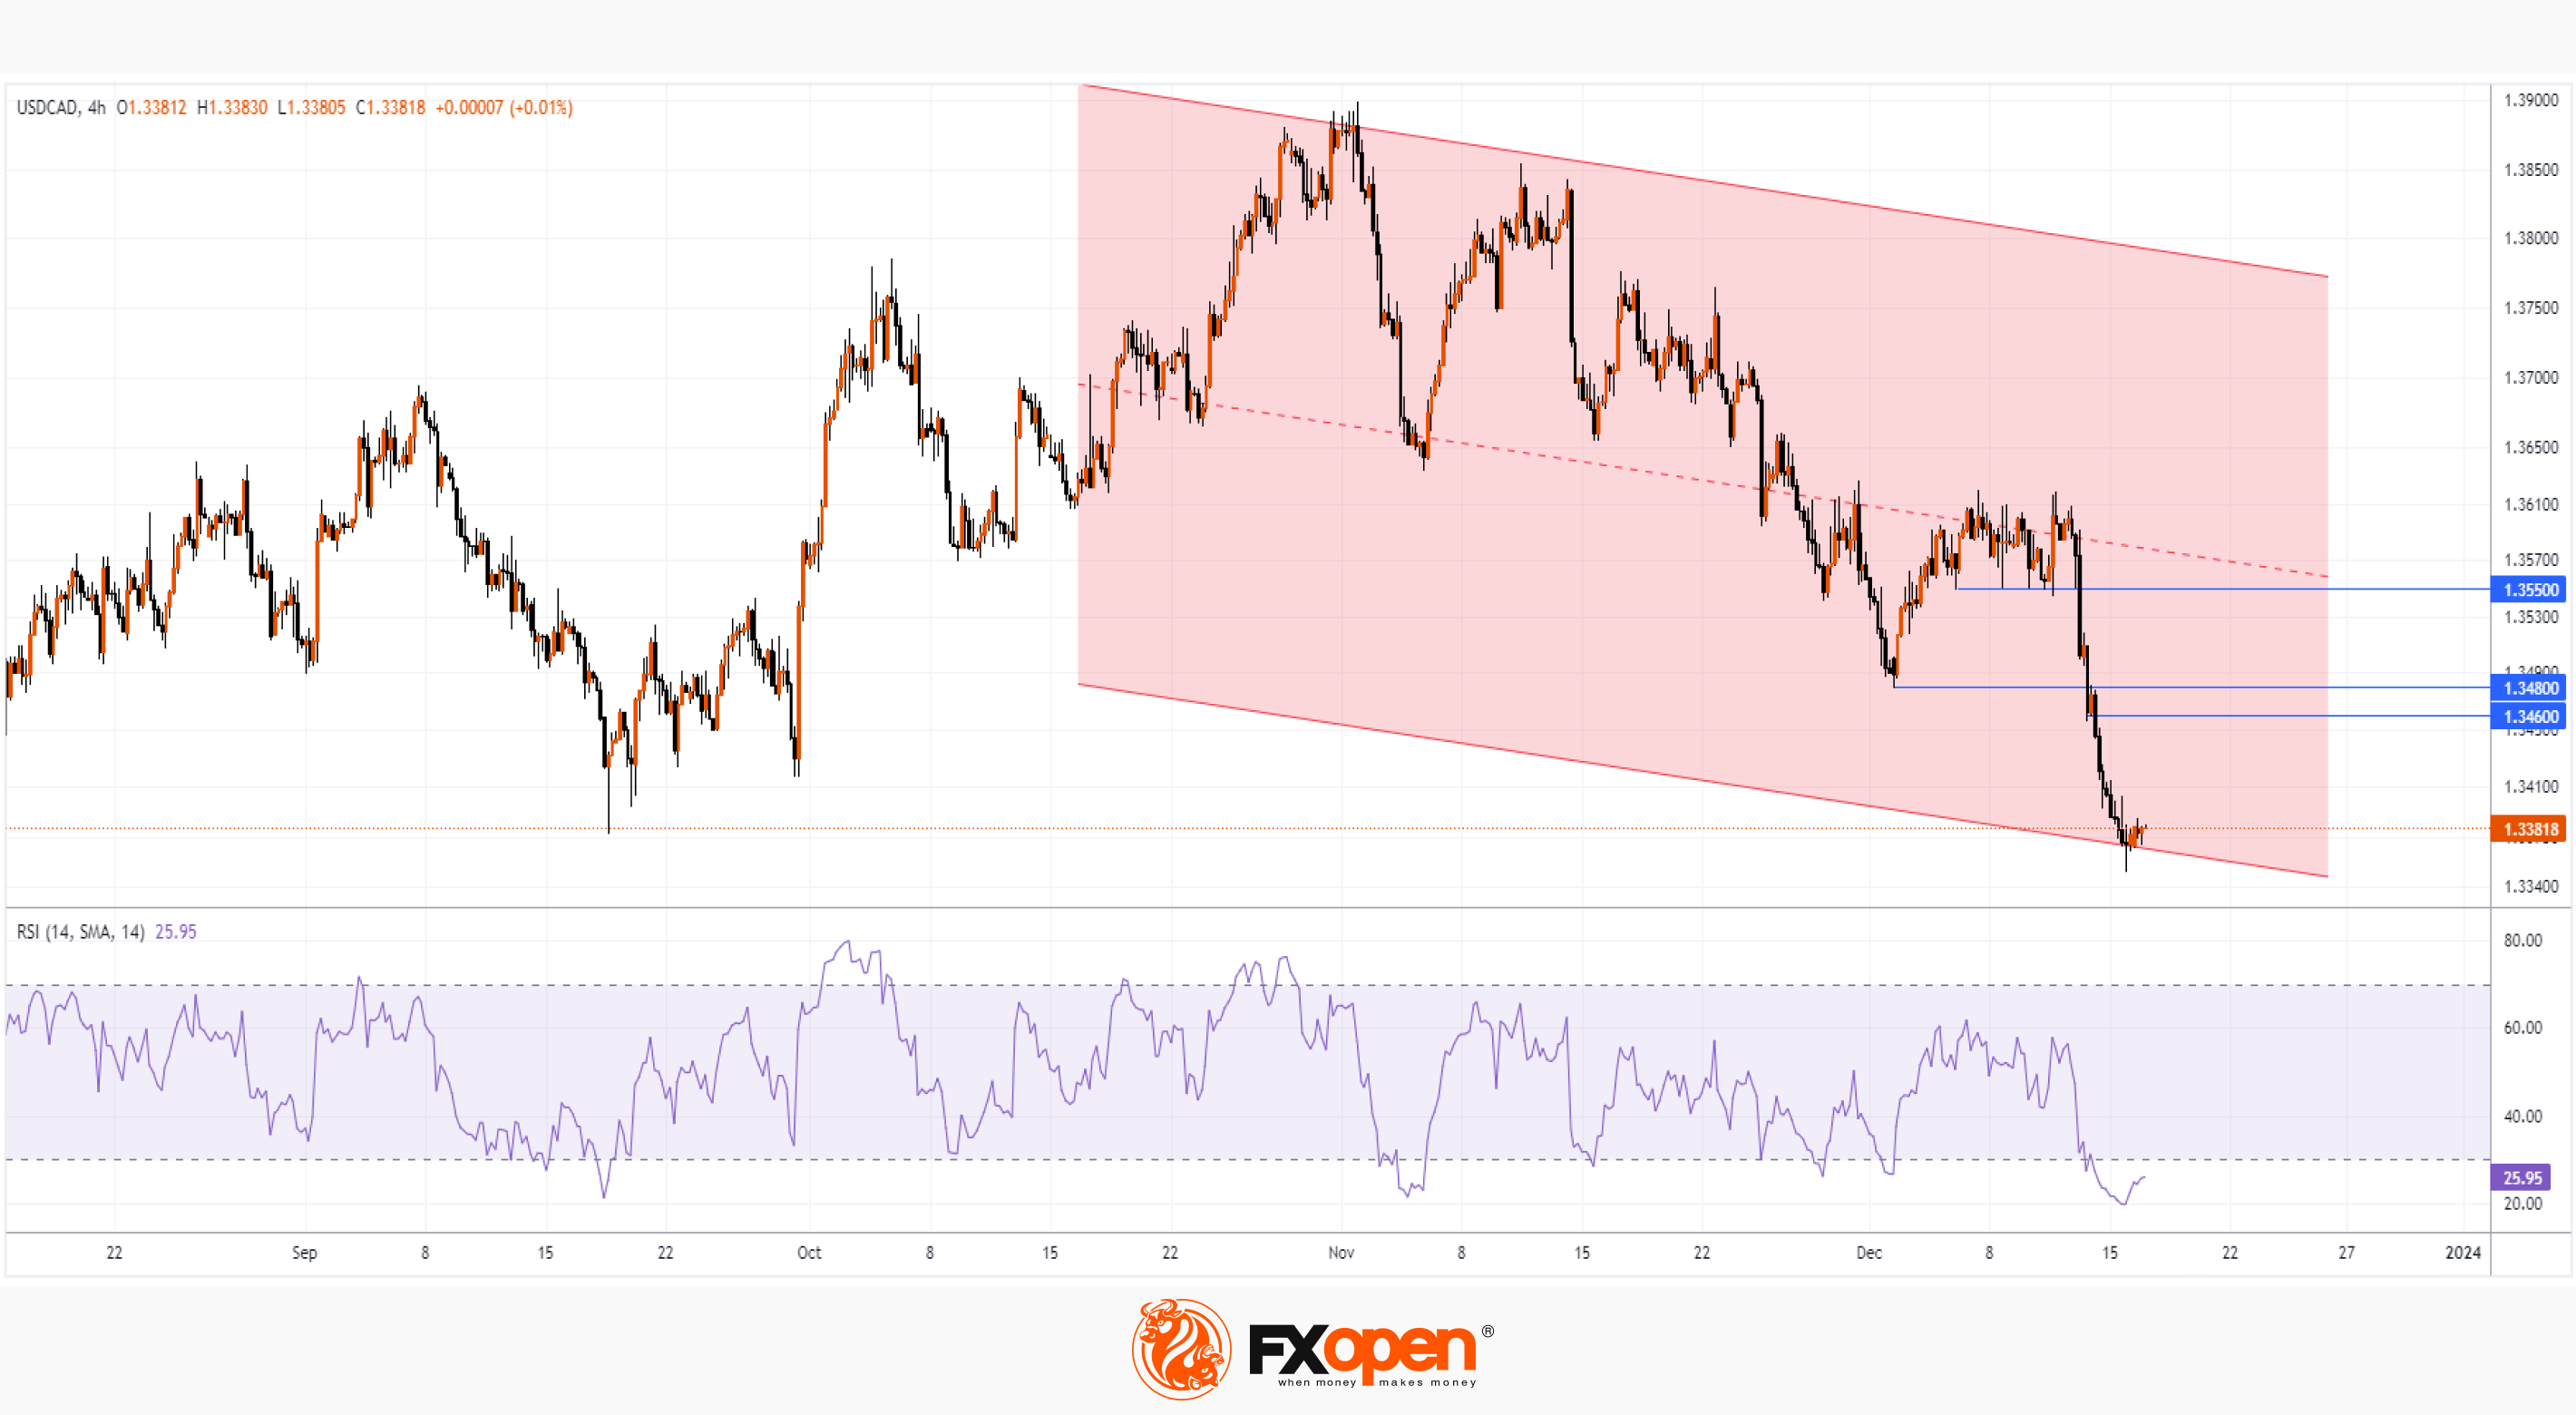
The current 4-hour chart shows that:
→ the USD/CAD price forms a downward channel (shown in red). What is noteworthy is that the price dropped to its lower limit (potential support);
→ the RSI indicator indicates a strong oversold market;
→ the price only dropped slightly below the September low, and then consolidated intraday - forcing attention to the formation of a false breakout of the low.
Taking into account the above arguments, it is worth assuming a scenario of a rebound from the lower border of the channel. For example, it is possible that the price will test the area 1.346-1.348, or the former support 1.355, resistance from which may be strengthened by the median line of the channel.
Trade over 50 forex markets 24 hours a day with FXOpen. Take advantage of low commissions, deep liquidity, and spreads from 0.0 pips (additional fees may apply). Open your FXOpen account now or learn more about trading forex with FXOpen.
This article represents the opinion of the Companies operating under the FXOpen brand only. It is not to be construed as an offer, solicitation, or recommendation with respect to products and services provided by the Companies operating under the FXOpen brand, nor is it to be considered financial advice.
Stay ahead of the market!
Subscribe now to our mailing list and receive the latest market news and insights delivered directly to your inbox.


Latest articles

Amazon Earnings: Does the Chart Already Know Something the Numbers Don't?
All eyes are on July 30, when Amazon reports Q2 2026 earnings, with Wall Street increasingly convinced the bar has been set too low. Consensus sees EPS near $1.82-$2.26 on roughly $197 billion in revenue, but the

WTI Analysis: Gap Breaks Short-Term Trend as Price Remains Trapped Between the POC and Profile Boundary
WTI crude oil plunged by more than 7% on 27 July 2026 after the US suspended a series of strikes against Iran over the weekend, raising hopes of a diplomatic solution and the reopening of shipping through the Strait of

US Dollar Index: A Defining Week for the King of the Markets
The dollar heads into a pivotal week trading near 101.80, just off a 15-month high, with the Fed's July 29 meeting standing as the clear focal point. Markets currently price roughly a 65% chance of a hold, though renewed