


USD/CHF Analysis: Rate Rises to Its Highest in Six Months
FXOpen
This happened against the backdrop of rising US bond yields. Reuters writes that it is in the region of a 16-year high. It is reasonable to assume that big capital was balancing its defensive portfolio by selling the franc, considered a safe haven, and buying dollars to invest in American bonds, which also have high-quality status.
On July 13, we wrote that the franc could rebound from the lower line of the channel (shown in red). This was supposed to be facilitated by hawkish rhetoric from Fed officials and, as a result, the strengthening of the dollar.
However, now the situation has reversed. The USD/CHF rate expanded the range of a larger downward channel and reached its upper limit. It even tried to break out of it on October 3 (but without noticeable success).
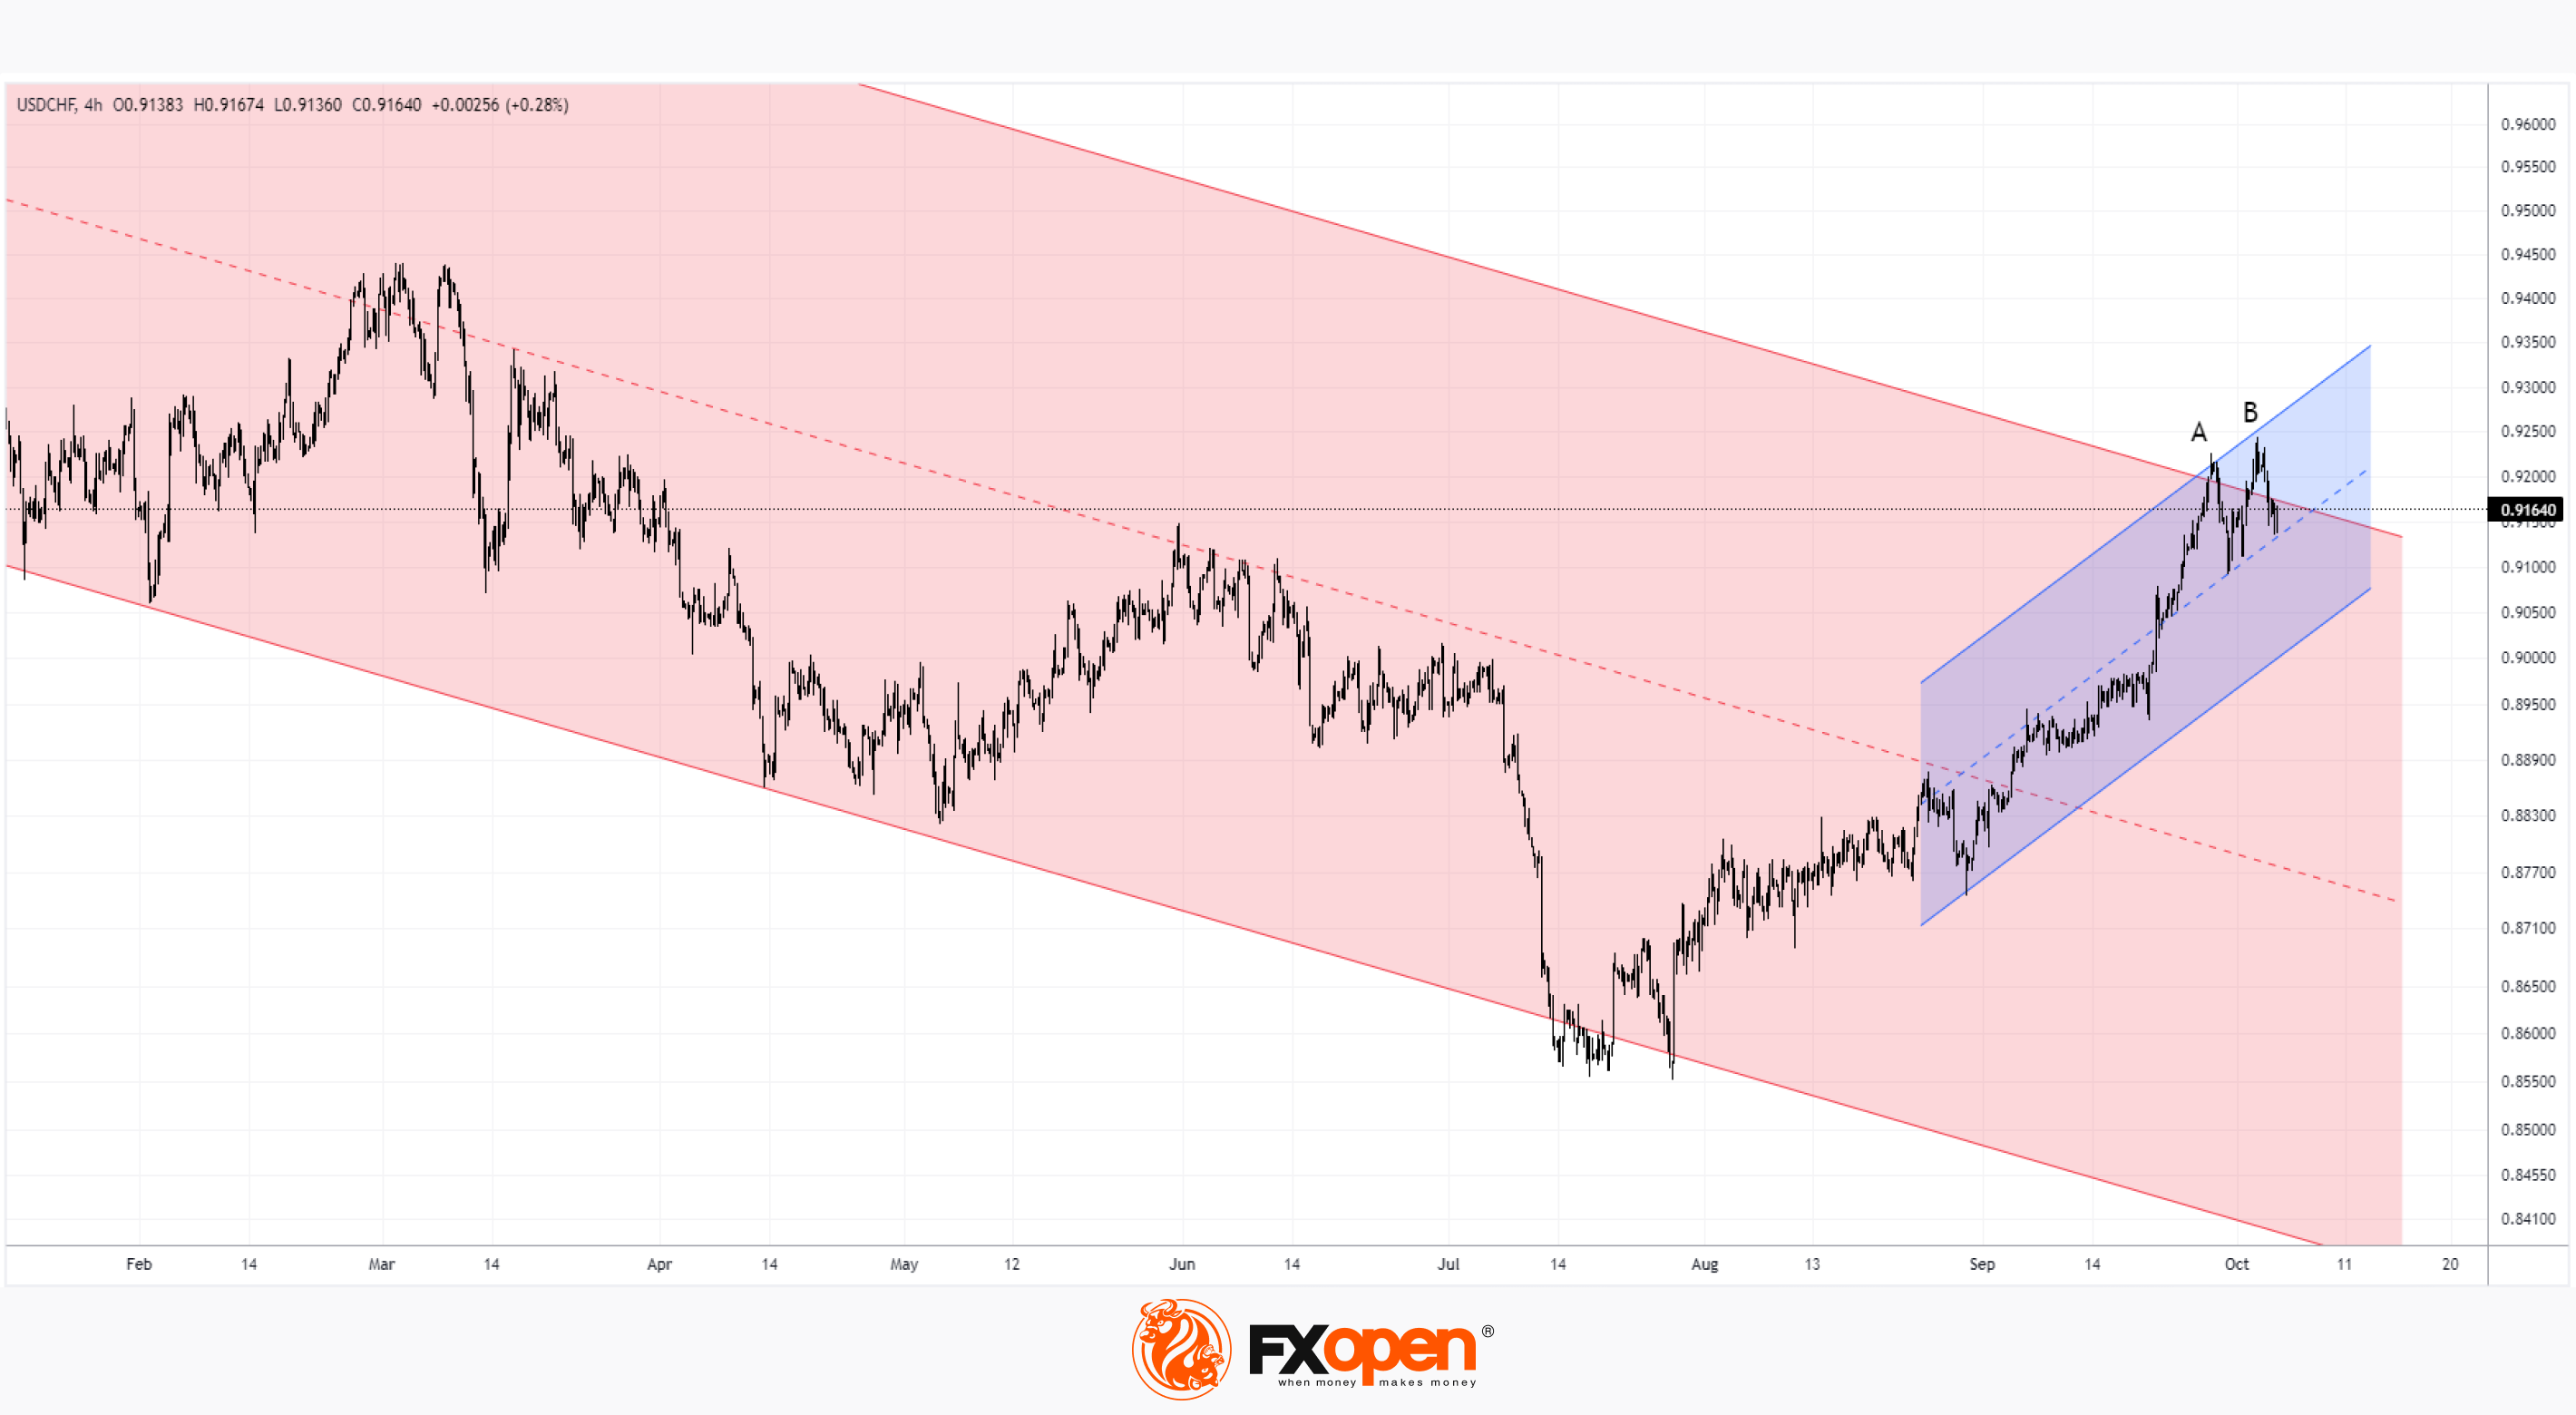
Will the bullish trend described by the rising channel (shown in blue) continue?
Signs of technical analysis provide grounds for doubt:
→ extremes A and B are similar to the double-top pattern. Moreover, the fact that the second peak is higher than the first can be interpreted as a bull trap;
→ the formation of divergence on indicators – as an indication of weakening demand for the dollar;
→ bearish activity may intensify as the listed signs are formed near the upper border of the red channel.
Thus, the likelihood of a decline to the lower border of the blue channel increases, and in the longer term, attempts at its bearish breakout.
Trade over 50 forex markets 24 hours a day with FXOpen. Take advantage of low commissions, deep liquidity, and spreads from 0.0 pips (additional fees may apply). Open your FXOpen account now or learn more about trading forex with FXOpen.
This article represents the opinion of the Companies operating under the FXOpen brand only. It is not to be construed as an offer, solicitation, or recommendation with respect to products and services provided by the Companies operating under the FXOpen brand, nor is it to be considered financial advice.
Stay ahead of the market!
Subscribe now to our mailing list and receive the latest market news and insights delivered directly to your inbox.


Latest articles

AUD/CAD: Months of Indecision — Is a Breakout Finally Coming?
The Australian dollar has clawed back most of its end-of-June losses, when it touched three-month lows against the greenback amid escalating Middle East tensions. Since then, sentiment has improved: the RBA's Assistant Governor Sarah Hunter signalled the board stands ready

USD/JPY: Battling at the Top of the Triangle
On 3 July, Japan's Finance Minister, Satsuki Katayama, stated that the Ministry of Finance remains in close contact with US authorities regarding developments in USD/JPY as the yen traded near its weakest level in almost 40 years. Similar verbal

Dow Jones (DJIA): Consolidation Beyond the Trend
Federal Reserve Chair Kevin Warsh testified before Congress on 14–15 July, reaffirming the Fed's commitment to bringing inflation back to target while providing no clear guidance on the future path of interest rates. Meanwhile, June inflation data came in