


USD/CHF Rate Falls Over 1% After SNB Chief's Statements
FXOpen
As evidenced by the USD/CHF chart, yesterday one US dollar was worth 0.913 Swiss francs, but today it is already 0.903, indicating a rate drop of approximately 1%.
According to MT Newswires, the franc's strengthening is attributed to statements by Swiss National Bank (SNB) President Thomas Jordan. In his view, an overly weak franc is the most likely source of higher inflation in Switzerland.
Notably, since the beginning of 2024, the Swiss franc has weakened against the US dollar by more than 7%, one of the worst performances among G10 currencies. The exchange rate has formed an ascending trend channel (indicated in blue).
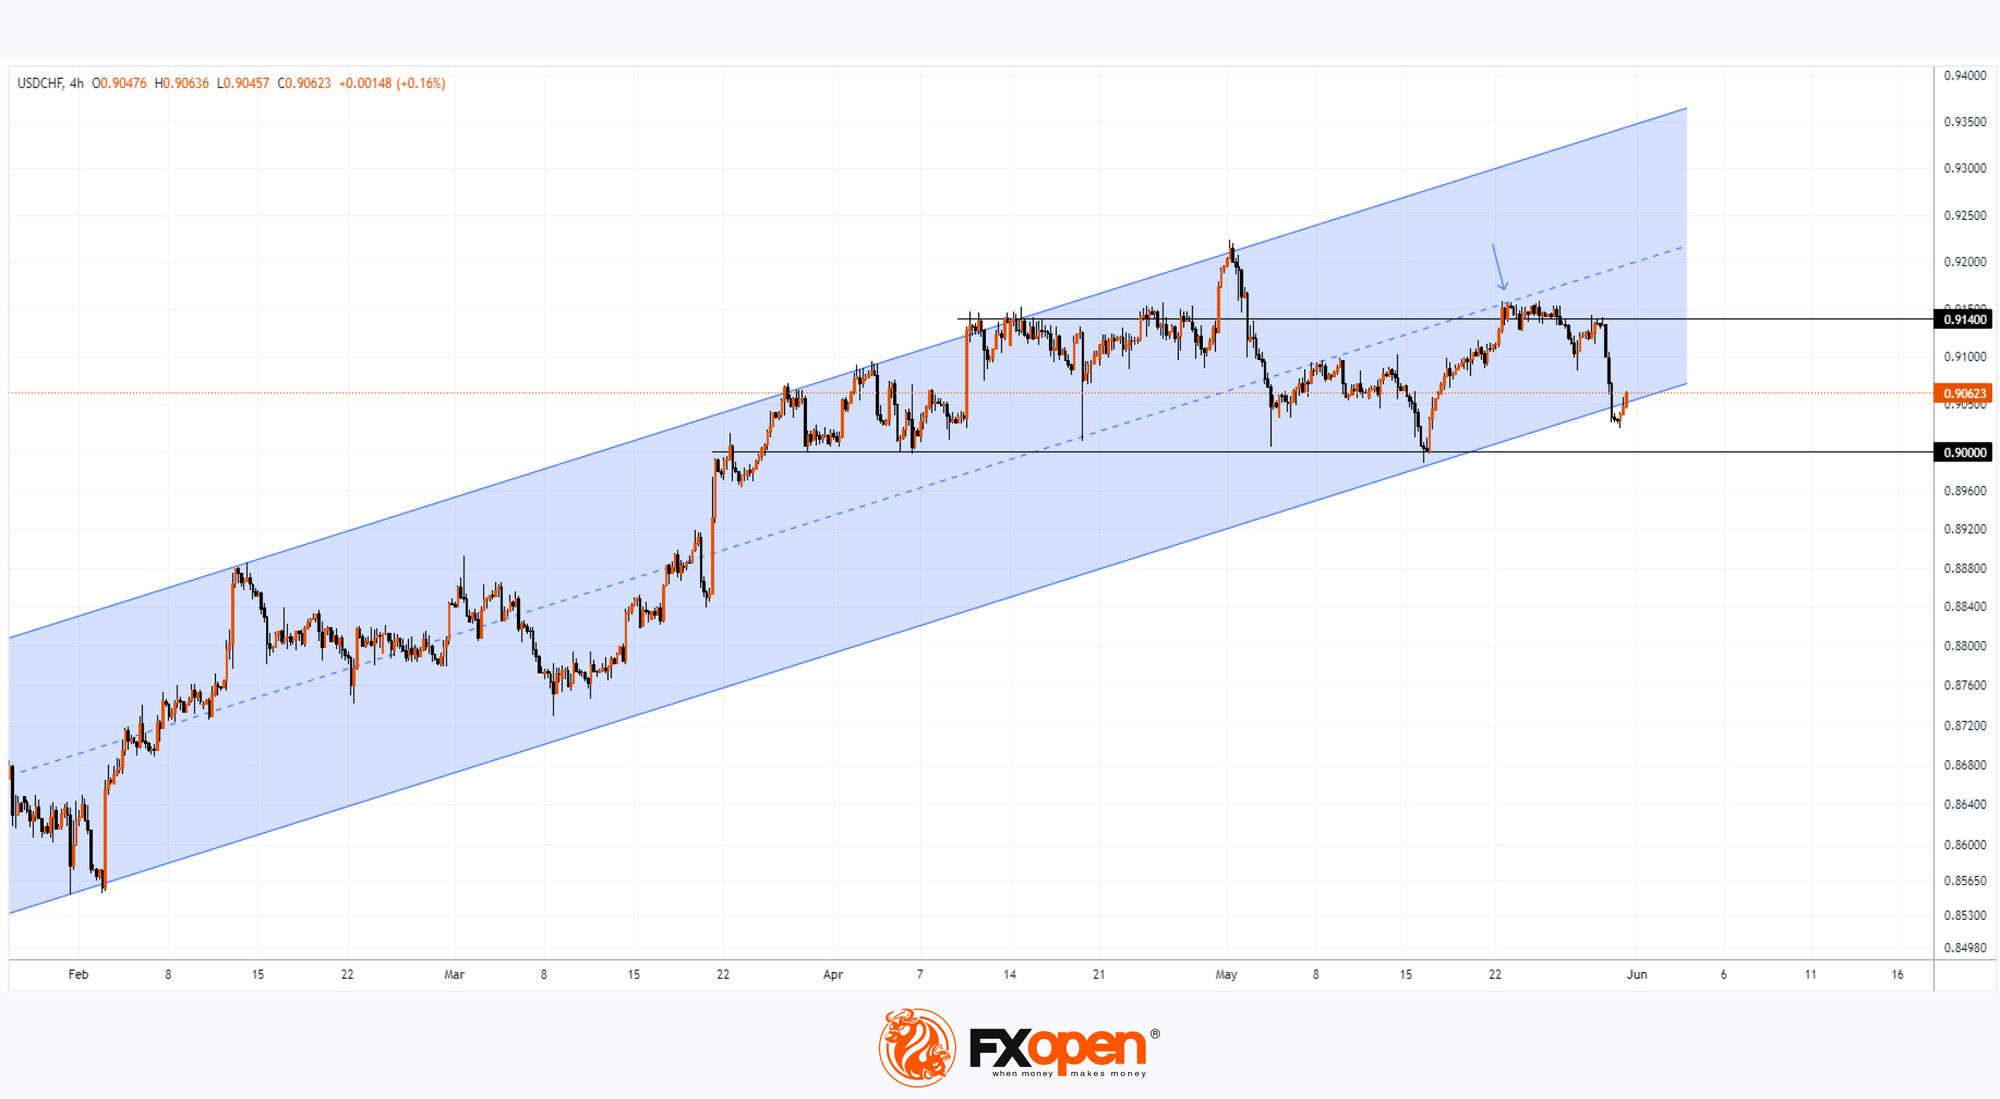
Today's USD/CHF chart shows two important resistance lines:
→ The 0.913 level – the price could not consolidate above this level despite several attempts;
→ The median line of the channel.
On May 22, a downward reversal occurred from this resistance block (indicated by an arrow), and today the USD/CHF price is near the lower boundary of the channel.
Bullish arguments:
→ Near the lower boundary of the channel, demand may increase;
→ The psychological level of 0.9 CHF per 1 USD may provide support – this has occurred several times during the spring.
It is likely that the SNB does not want the upward trend to continue, and if so, in the near future, we might see a consolidation in the USD/CHF market within the range of 0.900 – 0.913, until significant fundamental news emerges to disrupt the balance that has been forming since April.
Trade over 50 forex markets 24 hours a day with FXOpen. Take advantage of low commissions, deep liquidity, and spreads from 0.0 pips (additional fees may apply). Open your FXOpen account now or learn more about trading forex with FXOpen.
This article represents the opinion of the Companies operating under the FXOpen brand only. It is not to be construed as an offer, solicitation, or recommendation with respect to products and services provided by the Companies operating under the FXOpen brand, nor is it to be considered financial advice.
Stay ahead of the market!
Subscribe now to our mailing list and receive the latest market news and insights delivered directly to your inbox.


Latest articles

AI Valuations Are Back in the Spotlight
Artificial intelligence remains the dominant investment theme of 2026, but investors are increasingly questioning whether AI stock valuations are keeping pace with reality.
💰 Big Tech continues to invest at an unprecedented scale, with hyperscaler AI spending projected to exceed $800

AUD/CAD: Months of Indecision — Is a Breakout Finally Coming?
The Australian dollar has clawed back most of its end-of-June losses, when it touched three-month lows against the greenback amid escalating Middle East tensions. Since then, sentiment has improved: the RBA's Assistant Governor Sarah Hunter signalled the board stands ready

USD/JPY: Battling at the Top of the Triangle
On 3 July, Japan's Finance Minister, Satsuki Katayama, stated that the Ministry of Finance remains in close contact with US authorities regarding developments in USD/JPY as the yen traded near its weakest level in almost 40 years. Similar verbal