


FXOpen
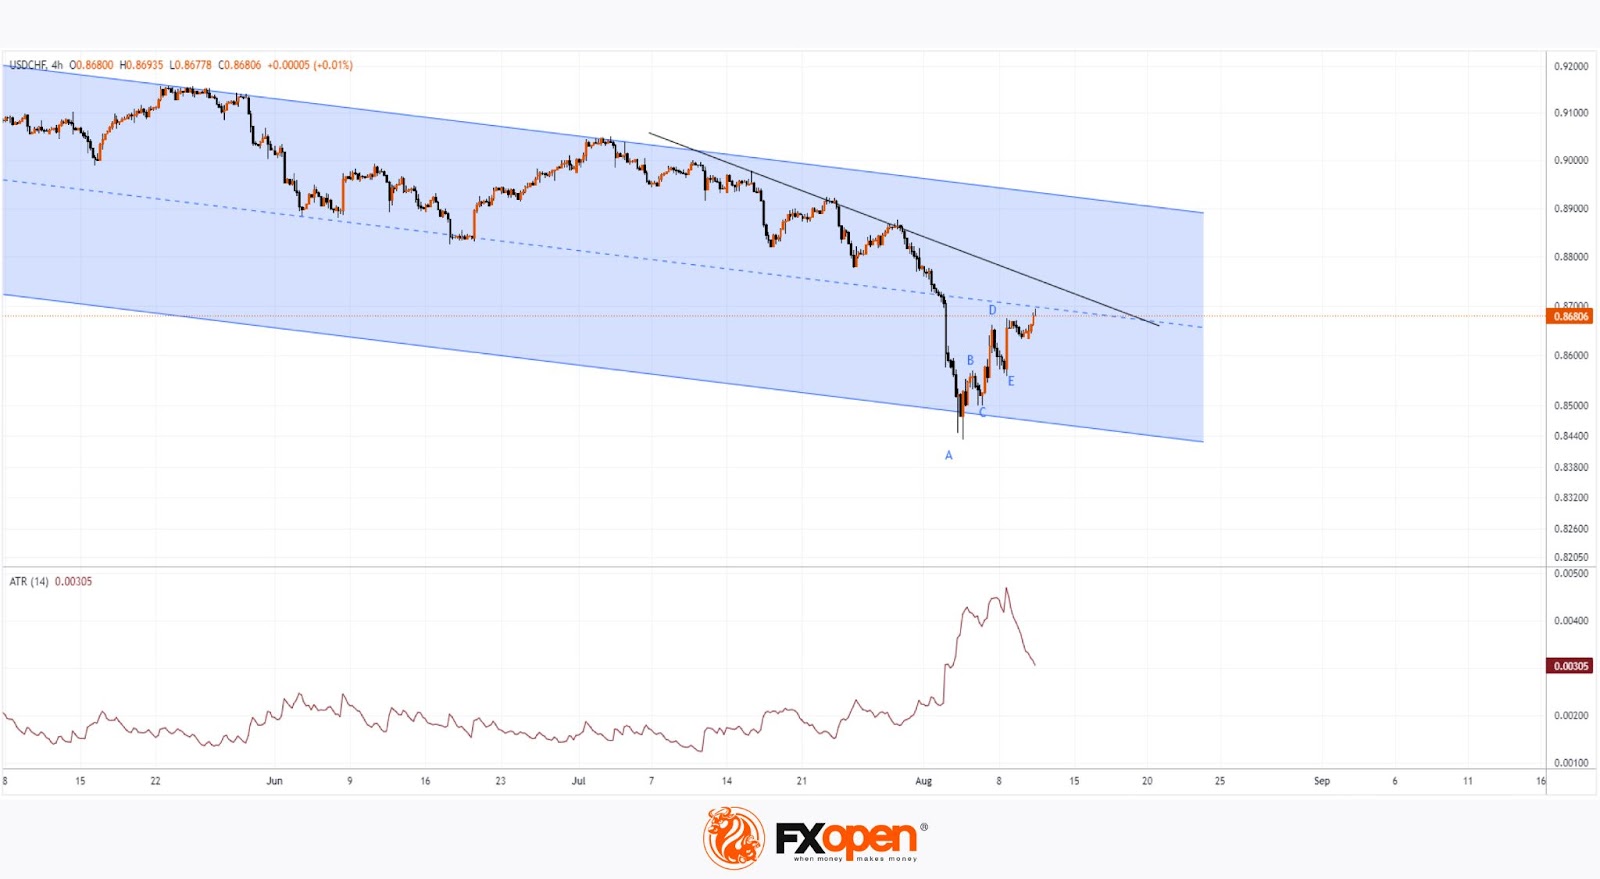
As indicated by the USD/CHF chart today, the rate is around 0.868 francs per US dollar, although it dropped below 0.85 last Monday.
The main driver of this surge in volatility (with the ATR indicator reaching its highest point since March 2023) was the decline in the Japanese stock market, which we covered twice last week: here and here. Market participants were actively buying the Swiss franc as a “safe haven” asset. However, when the Nikkei 225 (Japan 225 on FXOpen) began to recover from its nine-month lows, demand for the franc weakened.
Technical analysis of the USD/CHF chart shows that:
→ The price has extended the descending channel (shown in red). The line that provided support as the lower boundary of the channel from April to July has now become the median, and resistance can be expected from it.
→ Additionally, resistance might be provided by the black trendline, which became relevant in July.
→ From another perspective, the A-B-C-D-E structure resembles a bullish formation, where the size of the downward retracement is approximately 50% of the previous upward impulse.
And what about the fundamental backdrop?
Perhaps the most significant event of the week will be the US Consumer Price Index data for July on Wednesday (at 15:30 GMT+3), which is expected to show a slight increase in monthly inflation. This is no longer seen as a major concern. According to Reuters, Timothy Graf, senior macro strategist at State Street, said: “Inflation is no longer the problem it once was.”
Given these factors, there is reason to believe that in the coming days, the USD/CHF rate may stabilise around the red median line, after which a new impulse might form on the chart, signalling a reaction to the release of the US inflation news.
Trade over 50 forex markets 24 hours a day with FXOpen. Take advantage of low commissions, deep liquidity, and spreads from 0.0 pips (additional fees may apply). Open your FXOpen account now or learn more about trading forex with FXOpen.
This article represents the opinion of the Companies operating under the FXOpen brand only. It is not to be construed as an offer, solicitation, or recommendation with respect to products and services provided by the Companies operating under the FXOpen brand, nor is it to be considered financial advice.
Stay ahead of the market!
Subscribe now to our mailing list and receive the latest market news and insights delivered directly to your inbox.


Latest articles

European Currencies Decline: Pound Hits New Lows, Euro Under Pressure
European currencies continue to weaken against the US dollar amid rising geopolitical tensions and increased demand for safe-haven and liquid assets. Market participants are reducing exposure to riskier instruments, putting pressure on both the euro and the pound. Additional support

Market Analysis: GBP/USD Dips Further As EUR/GBP Regains Traction
GBP/USD failed to climb above 1.3500 and corrected some gains. EUR/GBP started a decent increase and might aim for more gains above 0.8700.
Important Takeaways for GBP/USD and EUR/GBP Analysis Today
· The British Pound
