


What Is Average True Range (ATR) and How Is It Used?
FXOpen
The average true range (ATR) is a technical analysis indicator traders use to determine asset price volatility over a specified timeframe.
The ATR shows how much an asset price has moved on average during a given period and how much it could be expected to move. Traders analyse the ATR in combination with other technical indicators and oscillators to decide when to enter and exit trading positions on volatile price swings.
What is the ATR indicator based on, and how does it work? This FXOpen guide provides an average true range definition and explains how you can use it in your trading strategies.
ATR Indicator Explained
The average true range is a type of moving average that was developed in 1978 by American technical analyst J. Welles Wilder Jr. He explained how to calculate the ATR in his book New Concepts in Technical Trading Systems. Wilder also developed the relative strength index (RSI), the parabolic stop and reverse (SAR), and the average directional index, which are core indicators that are used in technical analysis today.
Wilder initially designed the ATR volatility indicator to analyse commodities markets, but it is now applied to other products, such as stocks, indices, and forex pairs.
The average true range does not indicate price trends or direction. Instead, it calculates the average price variation, including any gaps, of an asset within a number of periods.
The ATR typically calculates volatility over days, but it is also used to analyse intraday, weekly, or monthly volatility. While the indicator is usually calculated for a 14-period, traders can use the formula to measure volatility over shorter periods, such as two or 10, or calculate longer-term volatility from periods of 20 to 50.
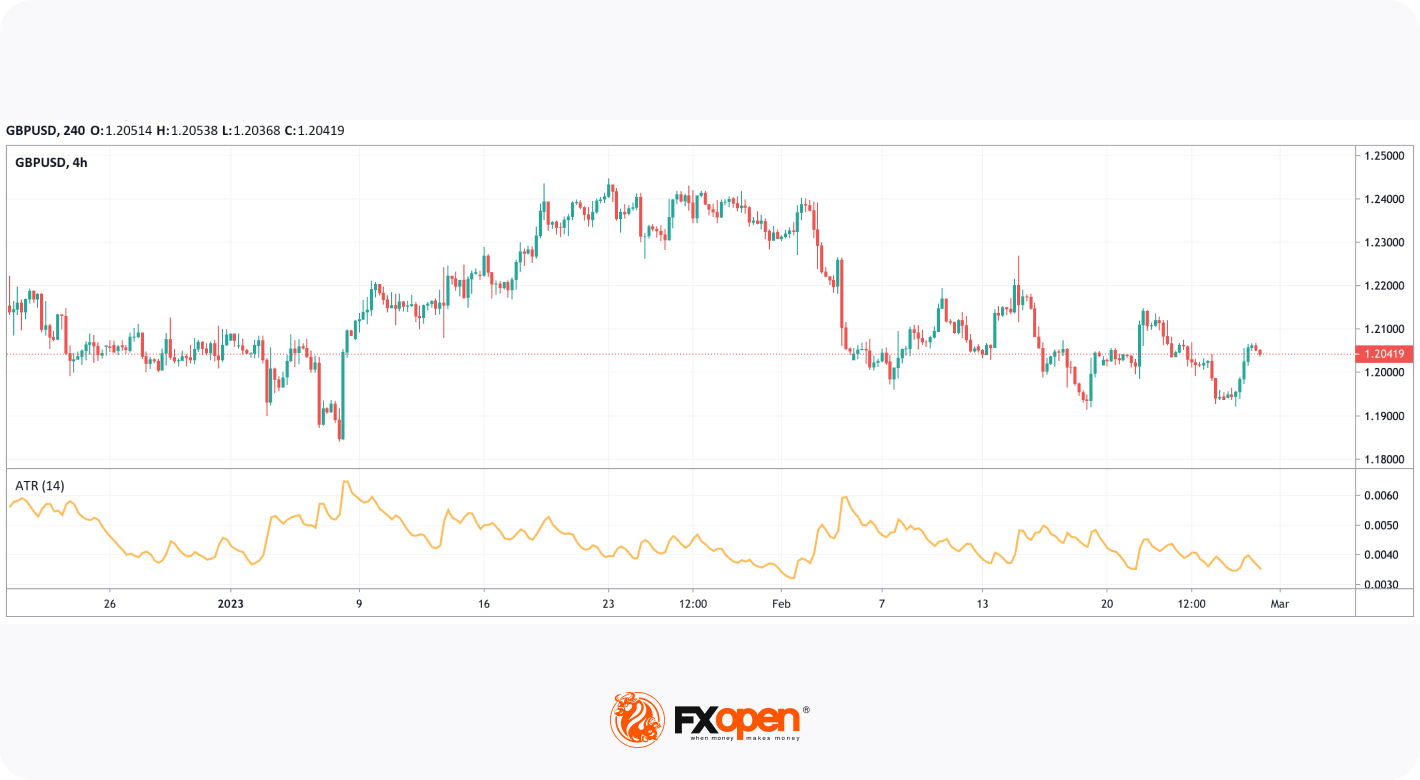
Readings are plotted under a chart in a continuous line that shows a smoothed moving average (SMMA) of the true range values to represent how the price volatility has changed over time.
Calculating the Average True Range
You can find the average true range indicator on trading platforms such as TickTrader, where it is automatically calculated so you don’t need to do it manually. However, it is useful to understand how to calculate the average true range, to make informed decisions about which settings to use for your trading strategy.
The average true range calculation is relatively simple. The ATR moves up and down as the price movement becomes larger or smaller. It uses historical price data, so as soon as a new time period passes, it generates a new value. For example, on a one-minute technical chart, a new reading is calculated each minute, while on a daily chart, a new reading is generated each day.
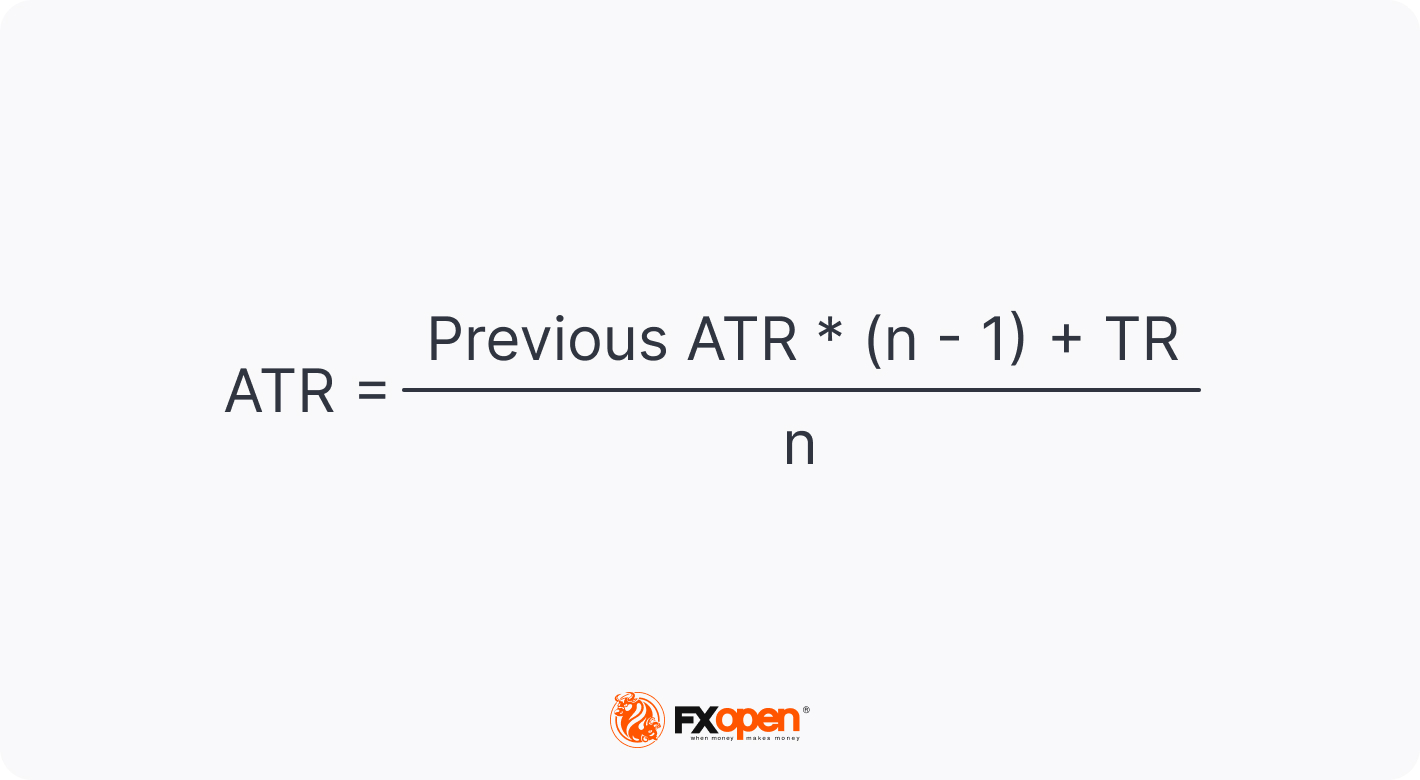
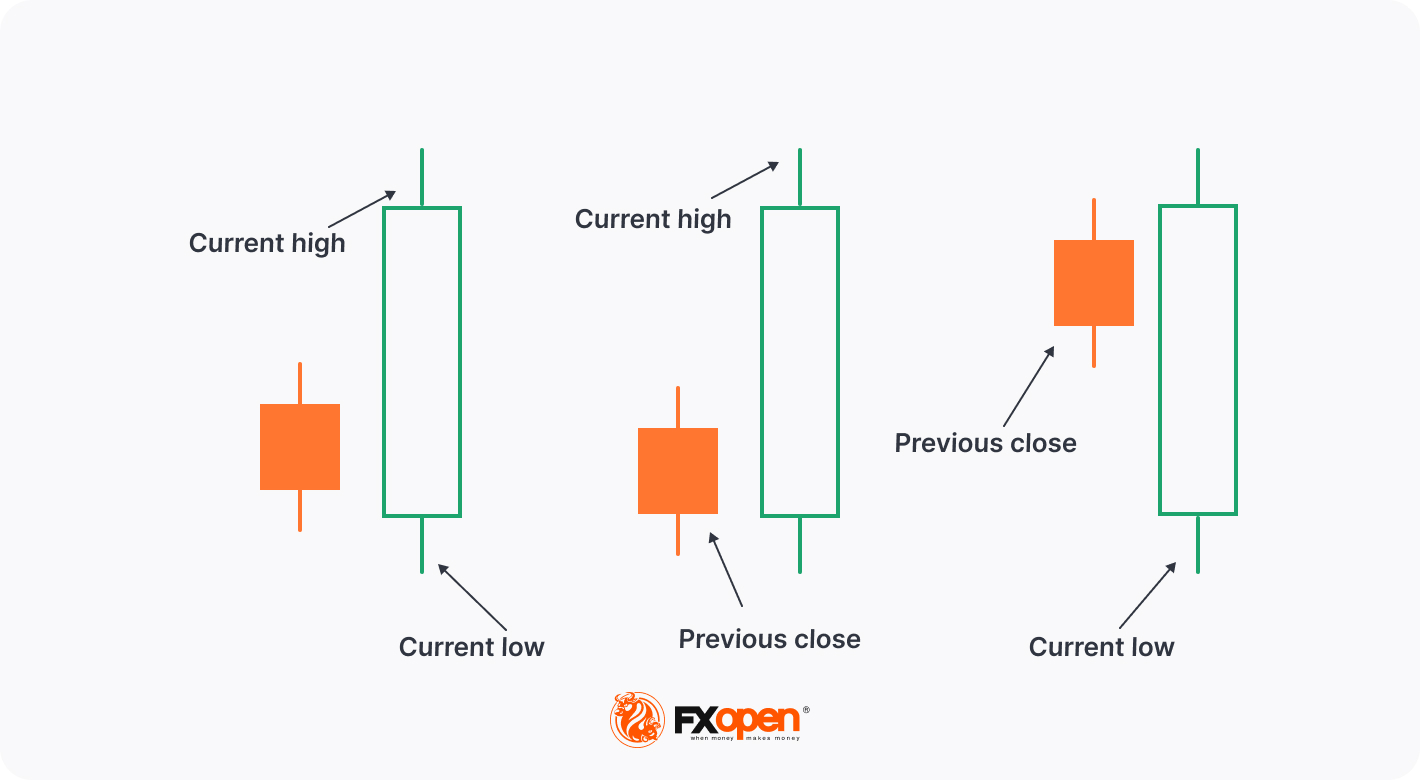
To calculate the current average true range, you need to calculate the prior ATR and current TR. The current TR is the highest number of three true ranges (TRs) calculated as follows:
- Current high minus current low.
- Current high minus the previous period’s close.
- Current low minus the previous period’s close.
As for prior ATR, if you analyse a 14-day period, you calculate the prior ATR from the highest values for each day, adding together the highest values and dividing the total by 1/n, with “n” representing the number of periods, so in this case, it is 1/14.
Once you have the TR and prior ATR, you calculate the current ATR from Wilder’s formula to smooth out the data with a moving average.
How Does the ATR Work?
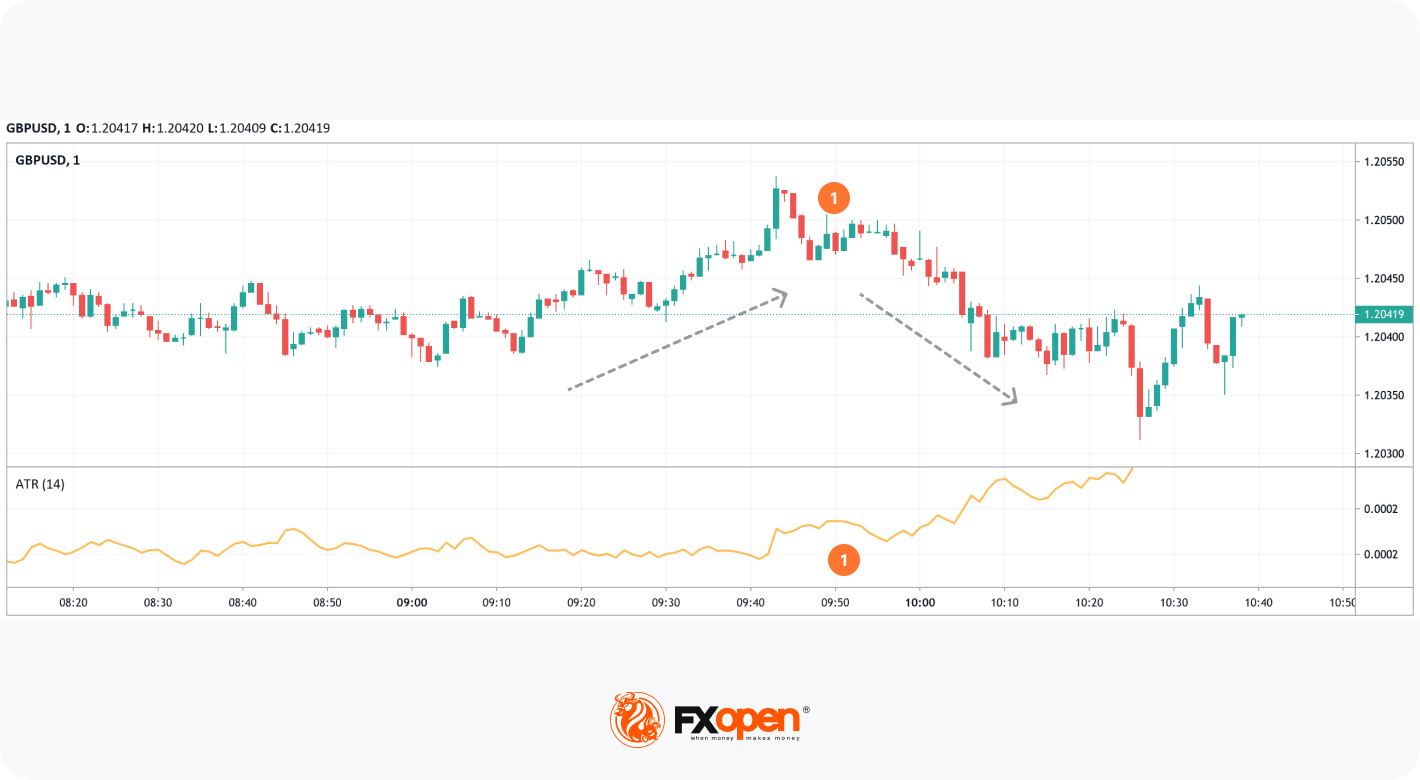
The average true range line on a chart rises as volatility increases and falls as volatility declines. As the ATR is not directional, it reflects an increase in volatility in either direction, with either buying pressure or selling pressure rising. A change in price direction while the line is rising suggests that there is strength behind the move.
A high ATR is typically generated by a sharp advance (1) or decline in price. That heightened volatility is unlikely to be sustainable for extended periods. Trading high ATR stocks or other assets may help traders maximise chances for a successful trade during times of heightened volatility.

A low ATR indicates that the asset is experiencing low volatility and the price is moving in a tight range. If the value remains low for a prolonged period, the price could be consolidating ahead of a potential continuation of a trend or its reversal (1).
How Do You Read ATR Values?
Average true range values represent absolute price volatility, not percentages. So, for example, if a stock trades between $19 and $22 during a session, following a previous close of $20, the current TR would be $3 based on the difference between the low and the high. If the prior ATR for the previous 13 days was $2, the stock’s average true range would be $2.07, based on the formula calculation: (($2 x 13) + $3) / 13.
Taking the example of the stock, which has an ATR of $2.07 and has moved in a $3 intraday range, we see that, although there is a buy signal, the stock has already moved more than 40% above the average and may not have much further to rise. The stock is more likely to stabilise within its recent price range or fall.
Conversely, if the price falls to the session low and the average true range for the day is larger than average, it could stabilise or move up to remain within the range despite a sell signal.
This shows the importance of using the average true range as only one of the several technical tools in a trading strategy. Rather than sell or buy an asset because the reading is higher than usual, a trader would use it to confirm a trade based on their complete analysis and particular strategy.
Also, it is important to track historical data because although an asset may trade well above or below the current ATR, the movement could be typical for the asset based on its price history.
Note: as the average true range represents an absolute value rather than a percentage, it cannot be used to compare stocks. For example, with a value of $2.07, the stock mentioned above would have an average price range of $2.07 over the period. Meanwhile, a stock with a TR of $300 and a prior ATR of $250 would have a current ATR of $253.57. That means assets with higher prices have higher ATRs than those with lower prices, so they are not directly comparable.
How Do You Use the ATR Indicator in Trading?
The ATR technical indicator is a key tool for traders looking to understand volatility patterns in a particular market and make informed trading decisions. Traders use it to evaluate an asset’s price volatility in combination with other technical analysis indicators and tools to decide when it is appropriate to enter and exit trades.
Long-term traders use ATR technical analysis to tune out market noise by accounting for daily volatility that might otherwise prompt them to close their positions early.
Day traders use the daily ATR to measure how much an asset moves during the day. The line on an intraday chart, such as a one-minute or five-minute chart, will spike at times of heightened volatility. For example, there tends to be more trading activity during the overlap between the London and New York sessions.
Traders can use the one-minute ATR to estimate how much an asset could move in the next five or 10 minutes. Dividing the expected profit by the average true range will indicate how many minutes it could take for the pair to reach the profit target. If the ATR on a one-minute chart of GBP/USD is 0.0002, the price is moving at a rate of around $20 every minute (standard lot), and it would take five minutes to move by $100 (standard lot).
Note: the ART constantly changes. Therefore, all calculations are very approximate, and many traders prefer to be pessimistic about price predictions. Also, it’s vital to remember that the ATR doesn’t reflect the price direction. Therefore, you need to determine the potential move using other technical or fundamental analysis tools.
Setting a Trailing Stop Loss
A trailing stop loss allows you to adjust the exit point on a trade if the price moves in your favour. You can consult the ATR trading indicator to determine where to place the trailing stop. While fixed price levels or percentages don’t allow for volatility, a trailing stop based on the ATR will adapt to sharp changes.
If you multiply the average true range by 1.5 or 2, you can use that figure to set the stop-loss point around your entry price. If you're buying, you place a stop loss at a point equivalent to twice the ATR below the entry price. If you're shorting an asset, you place the trailing stop at a point that is twice the ATR above the entry price and continue to move it once the price reaches a particular level.
Limitations of the ATR
While the average true range is relatively simple, it has two main limitations as a technical indicator.
- It is a subjective measure that is open to interpretation. No single ATR reading will clearly indicate whether a trend is about to reverse. Therefore, traders always compare ATR values with earlier readings for indications of the strength or weakness of a price trend.
- As it only measures volatility and not direction, it can generate mixed signals when trends pivot in the opposite direction. For example, a sudden rise in the ATR following a large move against the prevailing trend could give traders a false signal that the indicator is confirming an old trend.
Takeaway
The average true range is a relatively straightforward technical indicator used to determine price volatility. Traders calculate the average true range using only the price data for the period being analysed.
Traders use it in forex, stock, index, ETF, and cryptocurrency* trading to measure how much an asset has moved during a specified period. As with any technical analysis indicator, traders prefer using it in combination with other analytical tools as an aid to decide when to buy or sell. You can open an FXOpen account to practise using the ATR indicator on live price charts.
*At FXOpen UK and FXOpen AU, Cryptocurrency CFDs are only available for trading by those clients categorised as Professional clients under FCA Rules and Professional clients under ASIC Rules, respectively. They are not available for trading by Retail clients.
This article represents the opinion of the Companies operating under the FXOpen brand only. It is not to be construed as an offer, solicitation, or recommendation with respect to products and services provided by the Companies operating under the FXOpen brand, nor is it to be considered financial advice.
Stay ahead of the market!
Subscribe now to our mailing list and receive the latest market news and insights delivered directly to your inbox.


Latest articles

Tesla: Complex Range Structure Breaks Down Following Quarterly Earnings
Tesla released its Q2 2026 results after the market closed on 22 July. Revenue increased 26% year-on-year to $28.24 billion, while vehicle deliveries reached a record 480,126 units. However, operating margin fell sharply to 1.4%, down from

Pound Weakens After Soft UK Inflation Data as Euro Awaits Fresh Market Signals
The pound remains under pressure following the release of weaker-than-expected UK inflation data. The slowdown in inflation has strengthened expectations that the Bank of England could adopt a more accommodative policy stance in the coming months, weighing on sterling. Meanwhile,

Alphabet: Record Profit as Markets Await Their Verdict
On 22 July, Alphabet reported its Q2 2026 results, with revenue rising 24% year-on-year to $119.8 billion. Google Cloud revenue surged 82% to $24.77 billion, comfortably exceeding analysts' expectations. Search advertising generated $63.3 billion in revenue (+17%