


USD/JPY Analysis: Calm Before the Storm?
FXOpen

The USD/JPY chart today shows that the rate has stabilized at 152 yen per US dollar. But can we say that there is calm in the market?
Hardly.
First, it is important to note that in 2023 there was a sharp reversal of trend around the 152.00 level due to intervention by the Japanese authorities, which supported an excessively weak yen. Therefore, crossing this psychological threshold can serve as a trigger for a new intervention.
Secondly, Reuters writes about a growing volatility premium in the options market, which confirms the growing likelihood of a strong trend in the near future.
According to USD/JPY technical analysis:
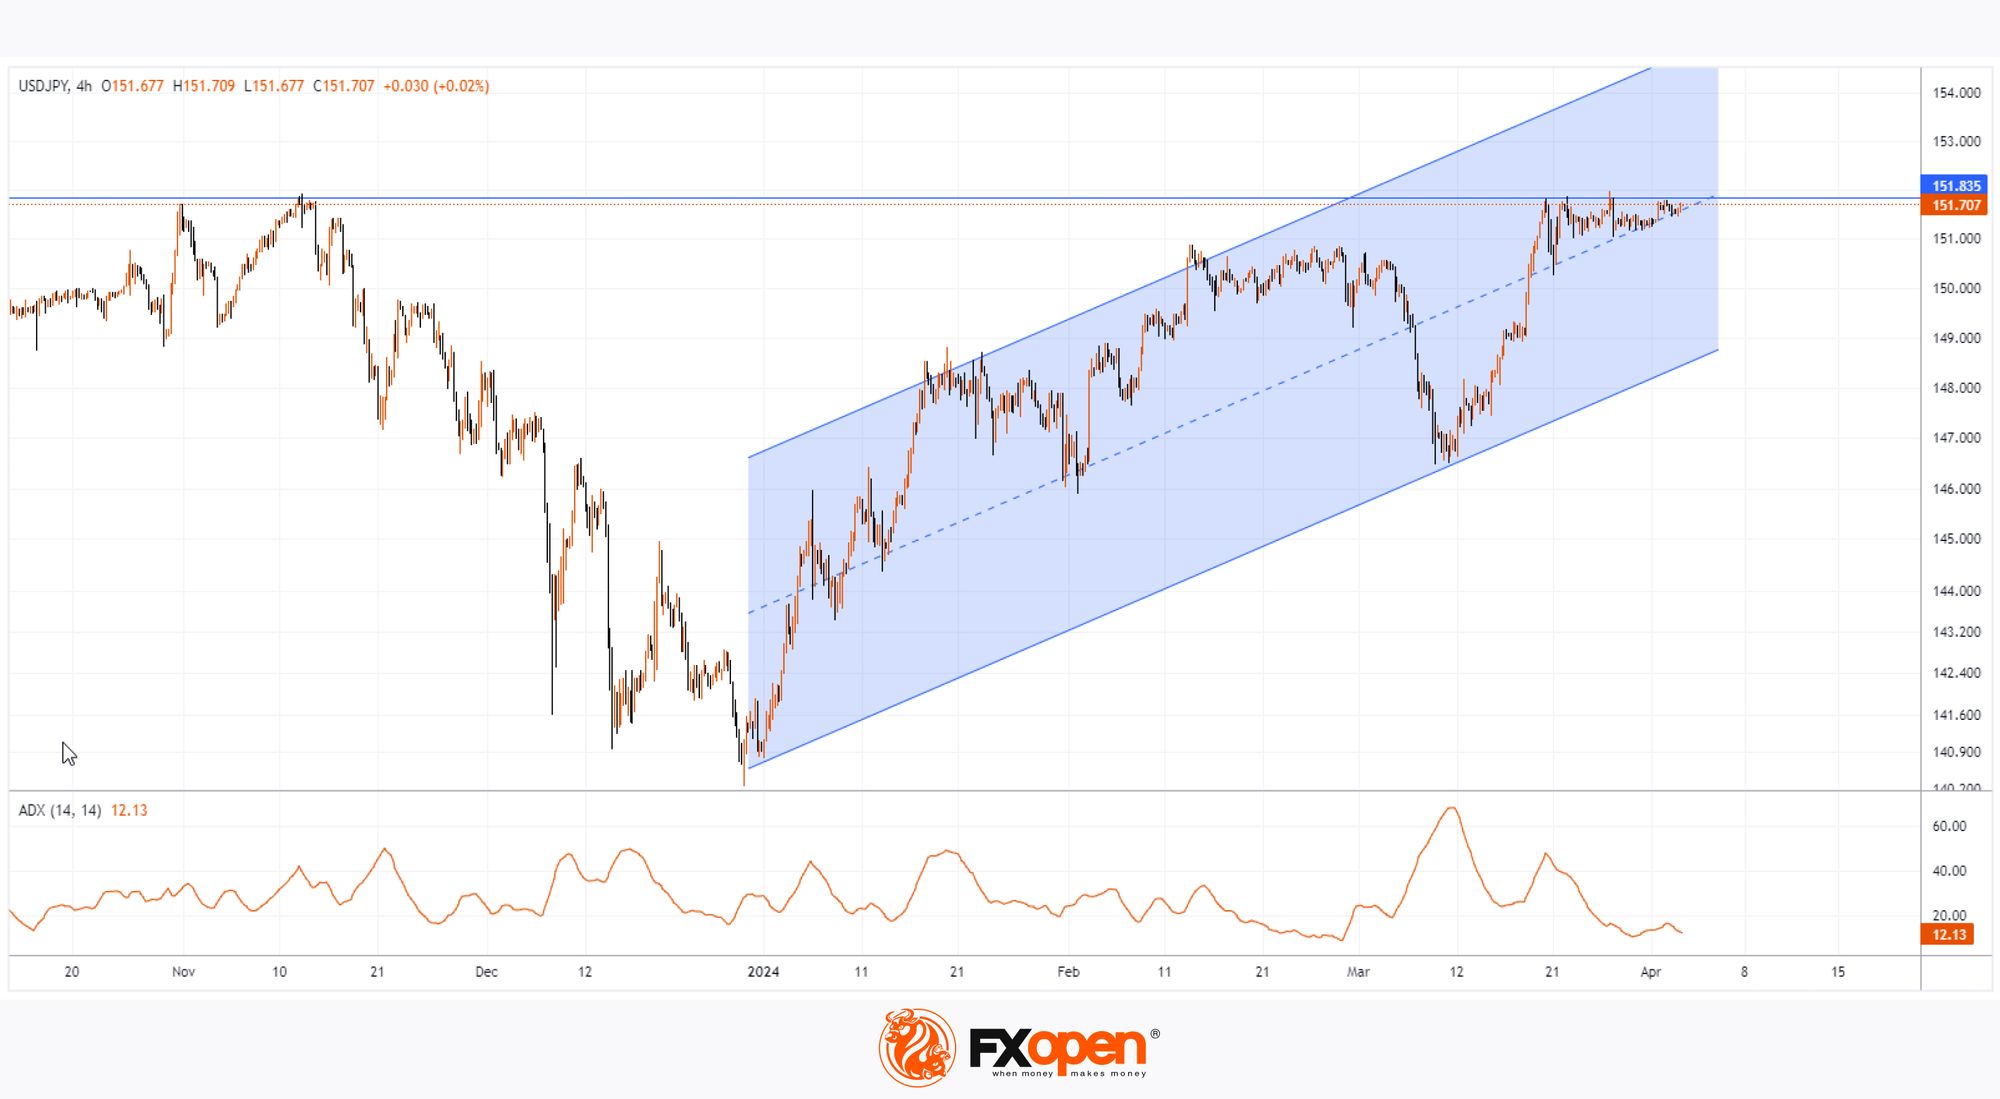
→ ADX indicator is near its lows. When this situation was observed at the end of February, 2 sharp movements followed in March: a decline in USD/JPY to 146.6 and a subsequent recovery to 151.6.
→ the price of USD/JPY today is squeezed into a narrowing triangle between the level of 152.0 and the median line of the ascending channel. The price exiting the technical triangle may mean the beginning of a new trend.
Today, 2 important news are expected: after the publication of the ISM Services PMI index (at 17:00 GMT+3), a speech by the head of the Federal Reserve is expected (19:10 GMT+3). A piece of fundamental news could change the valuation of the US dollar and lead to a surge in volatility in the USD/JPY market - this should be given special attention, given the arguments presented.
Trade over 50 forex markets 24 hours a day with FXOpen. Take advantage of low commissions, deep liquidity, and spreads from 0.0 pips (additional fees may apply). Open your FXOpen account now or learn more about trading forex with FXOpen.
This article represents the opinion of the Companies operating under the FXOpen brand only. It is not to be construed as an offer, solicitation, or recommendation with respect to products and services provided by the Companies operating under the FXOpen brand, nor is it to be considered financial advice.
Stay ahead of the market!
Subscribe now to our mailing list and receive the latest market news and insights delivered directly to your inbox.


Latest articles

USD/CAD: One Trendline Away From Deciding the Next Move
After several strongly positive weeks, USD/CAD has stalled over the past few sessions, entering a phase of uncertainty.
On the dollar side, Fed Chair Kevin Warsh has struck a firm tone, reaffirming the 2% inflation target and pushing back

Amazon: New Bond Issuance to Fund AI Infrastructure
On 7 July, Amazon announced an eight-tranche bond offering worth at least $25 billion, with the proceeds expected to finance the construction of data centres and the expansion of its artificial intelligence infrastructure. Investor demand peaked at $62 billion, highlighting

Weekly Market Insights with Gary Thomson: US Inflation, UK GDP, Chair Warsh Testimony, and Earnings
In this video, we’ll explore the key economic events and market trends, shaping the financial landscape. Get ready for insights into financial markets to help you navigate the week ahead. Let’s dive in!
In this episode of Market