


USD/JPY Analysis: The Rate Exceeds The Level of 155 Yen Per US Dollar
FXOpen

Today, the price of USD/JPY once again renewed its 34-year high, exceeding the level of 155 yen per dollar, which put pressure on the current authorities.
According to Reuters, officials are trying to maintain calm in the market.
"We will closely monitor market movements and respond accordingly," Finance Minister Shunichi Suzuki told parliament on Thursday as an opposition lawmaker called on him to intervene in the foreign exchange market.
Chief Cabinet Secretary Yoshimasa Hayashi confirmed that the Japanese authorities are ready to take action as necessary: "It is important that exchange rates move steadily, reflecting fundamental data. Excessive volatility is undesirable." He declined to comment on the yen's recent movements or the possibility of currency intervention.
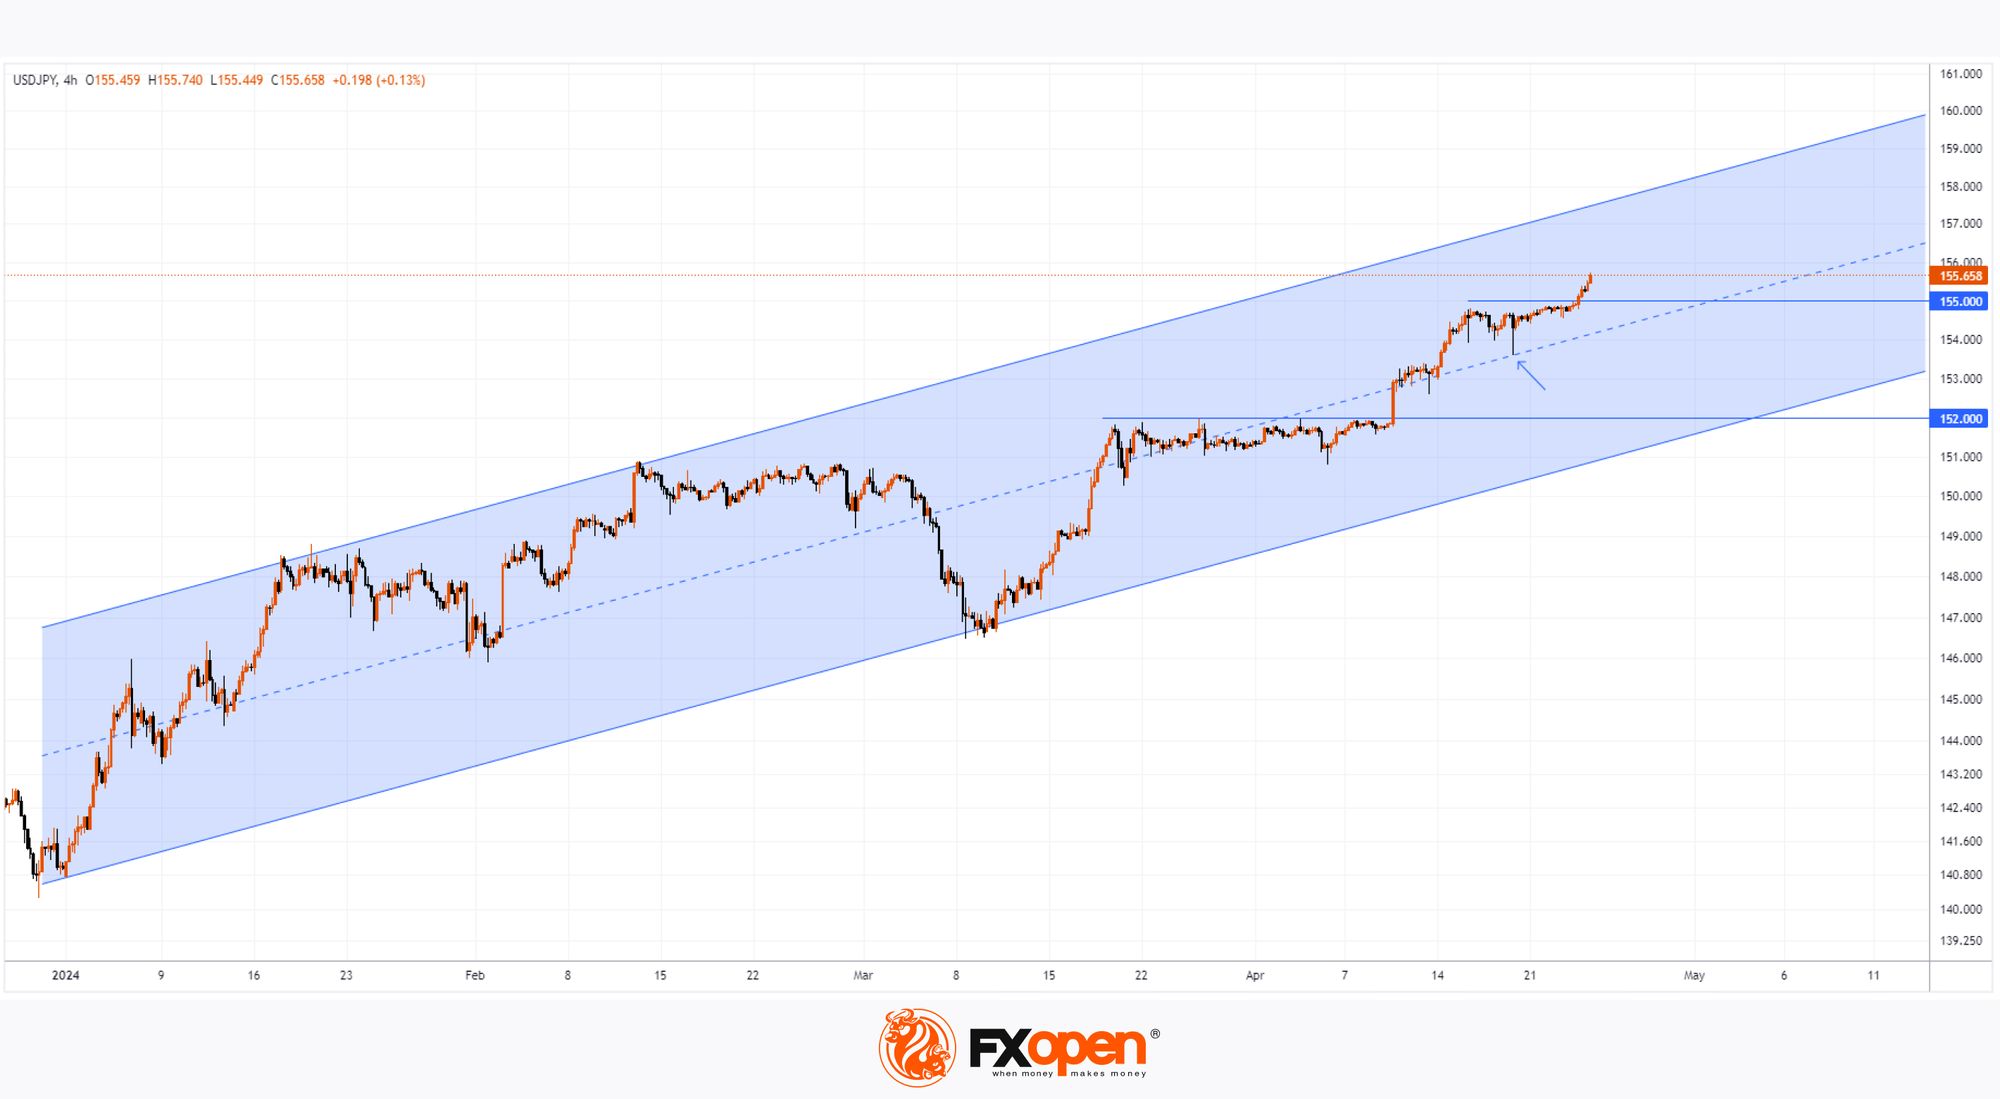
As technical analysis of the USD/JPY chart shows:
→ The price moves within the ascending channel (shown in blue), which has been in effect since the beginning of 2024.
→ The long lower shadow on the candle on April 19 (shown by the arrow) marked a test of the median line, which acts as support for the price.
→ Pay attention to the nature of the growth after the breakdown of the level of 152 yen per dollar, in the area of which the 2022 maximum was recorded. The price did not test this level after the breakout, indicating the strength of demand. If bullish sentiment remains as stable, the price of USD/JPY may continue to rise towards the upper border of the ascending channel. But everything can change the fundamental background.
Market participants' attention is now focused on the Bank of Japan's interest rate decision tomorrow. Although analysts expect rates to remain unchanged, according to ForexFactory, it is possible that announcements could be sharp enough to dramatically change the situation for the extremely weakened yen.
This article represents the opinion of the Companies operating under the FXOpen brand only. It is not to be construed as an offer, solicitation, or recommendation with respect to products and services provided by the Companies operating under the FXOpen brand, nor is it to be considered financial advice.
Stay ahead of the market!
Subscribe now to our mailing list and receive the latest market news and insights delivered directly to your inbox.

Latest articles

USD/JPY and USD/CHF Near Key Levels: The Dollar Supported by the Fed
The US dollar continues to trend upwards following the Federal Reserve meeting, drawing support from the regulator’s moderately hawkish stance and comments by Jerome Powell. Markets interpret the Fed’s rhetoric as a signal that restrictive policy is likely

EUR/USD and GBP/USD consolidate ahead of the Fed decision
European currencies are showing subdued dynamics, entering a consolidation phase following their previous advance. Earlier, EUR/USD and GBP/USD broke out of their ranges and strengthened; however, the subsequent correction has led both pairs to retest the previously breached

Meta: V-Shaped Recovery Meets Heavy Volume Resistance
The movement in Meta Platforms shares is being driven by two competing narratives. On one hand, advertising revenue is benefiting from AI-based tools: the Advantage+ platform continues to support strong advertiser demand, and the analyst consensus for Q1 2026 revenue