


FXOpen

Despite today's public holiday in Japan, yen buyers remain active.
As shown on the USD/JPY chart, today's candle low has dropped below the psychological level of 140 yen per dollar. The last time this exchange rate was seen was on 28 July 2023.
On 11 September, when analysing the USD/JPY chart, we:
→ drew a descending channel (shown in red);
→ plotted a resistance line (shown in orange);
→ predicted the possibility of a bearish attack on the 140 yen per dollar level.
Current market sentiment is influenced by:
→ comments from Bank of Japan representative Junko Nakagawa, who stated last week that interest rates will continue to rise if economic and inflation forecasts align with expectations;
→ expectations of a rate cut from the Federal Reserve. A shift towards monetary easing now seems almost inevitable, with the main question being whether the rate will be reduced by 25 or 50 basis points.
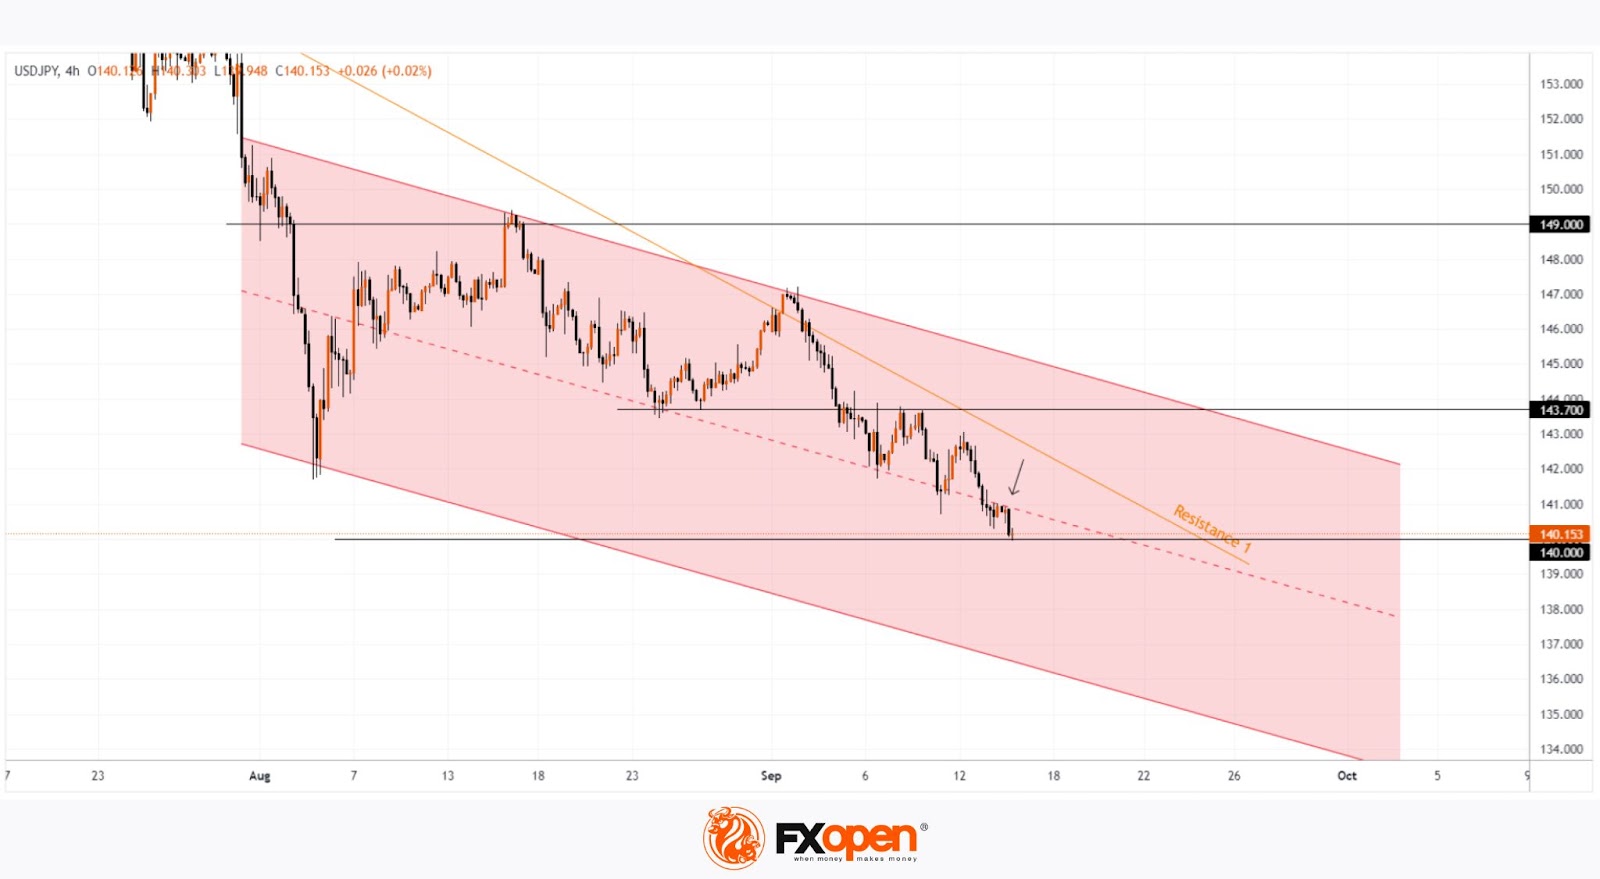
The technical analysis of the USD/JPY chart shows that the median of the descending channel acts as resistance (as indicated by the arrow). This suggests that bears remain in control. It's likely that these market sentiments will persist until Wednesday (21:00 GMT+3), when the Federal Reserve announces its decision – undoubtedly the key event of the week.
Trade over 50 forex markets 24 hours a day with FXOpen. Take advantage of low commissions, deep liquidity, and spreads from 0.0 pips (additional fees may apply). Open your FXOpen account now or learn more about trading forex with FXOpen.
This article represents the opinion of the Companies operating under the FXOpen brand only. It is not to be construed as an offer, solicitation, or recommendation with respect to products and services provided by the Companies operating under the FXOpen brand, nor is it to be considered financial advice.
Stay ahead of the market!
Subscribe now to our mailing list and receive the latest market news and insights delivered directly to your inbox.


Latest articles

Market Analysis: GBP/USD Dips Further As EUR/GBP Regains Traction
GBP/USD failed to climb above 1.3500 and corrected some gains. EUR/GBP started a decent increase and might aim for more gains above 0.8700.
Important Takeaways for GBP/USD and EUR/GBP Analysis Today
· The British Pound


Market Insights with Gary Thomson: Oil, US Retail Sales & NFP in Focus
In this video, we’ll explore the key economic events and market trends, shaping the financial landscape. Get ready for insights into financial markets to help you navigate the week ahead. Let’s dive in!
In this episode of Market