


USD/JPY Approaches Key Resistance Level
FXOpen

The USD/JPY chart shows a bullish trend at the start of March, influenced by the escalation of military activity in the Middle East.
On one hand, the US dollar is strengthening due to increased demand for safe-haven assets. On the other, the Japanese economy is under pressure because of its heavy reliance on oil imports from the Middle East.
These factors have pushed the pair above 159.20 JPY per USD this week, surpassing the January high (point A). The 2026 peak lies nearby; however, technical analysis suggests that bullish momentum may be fading.
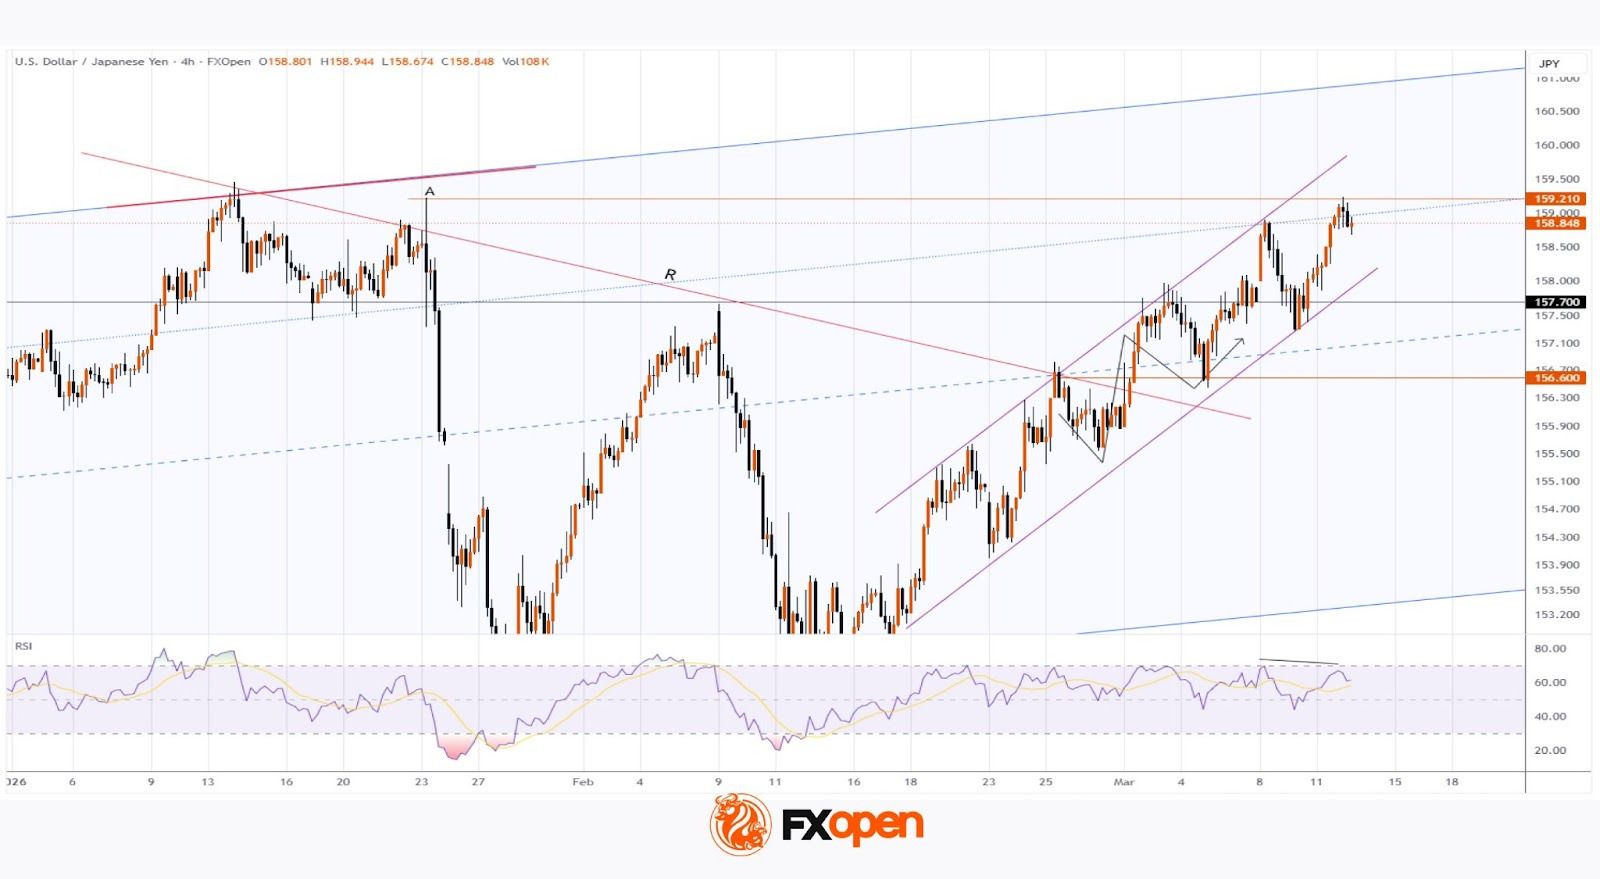
In our note of 26 February, we:
→ updated the wide ascending channel along with the intermediate growth trajectory (shown in purple);
→ highlighted signs of seller activity near 156.600.
As indicated by the arrow on the USD/JPY chart, after a small pullback to the lower purple line, buyers resumed their efforts, with the 156.600 level now acting as support.
Currently, we can observe that:
→ the RSI indicator is forming a bearish divergence;
→ it is becoming increasingly difficult for the price to reach the upper boundary of the purple channel;
→ the brief breach of point A resembles a bearish Liquidity Grab.
Additional bearish factors include:
→ the line dividing the upper half of the long-term channel into two parts;
→ proximity to the psychological 160 JPY per USD level.
It is worth recalling that in 2024, 1 USD briefly exceeded 160 JPY, but this level did not hold, as the Bank of Japan intervened. This context adds significance to the upcoming BOJ announcements, scheduled for next Thursday. Ahead of this event, USD/JPY may consolidate around current levels.
Trade over 50 forex markets 24 hours a day with FXOpen. Take advantage of low commissions, deep liquidity, and spreads from 0.0 pips (additional fees may apply). Open your FXOpen account now or learn more about trading forex with FXOpen.
This article represents the opinion of the Companies operating under the FXOpen brand only. It is not to be construed as an offer, solicitation, or recommendation with respect to products and services provided by the Companies operating under the FXOpen brand, nor is it to be considered financial advice.
Stay ahead of the market!
Subscribe now to our mailing list and receive the latest market news and insights delivered directly to your inbox.


Latest articles

GBP/USD and EUR/GBP Await Key Bank of England Decision
The pound strengthened following the outcome of the US Federal Reserve meeting, where the central bank, as expected, kept interest rates unchanged. However, the Fed did not provide the market with clear signals of an imminent shift towards rate cuts,

Microsoft Analysis: Earnings Beat Expectations
On 29 July 2026, Microsoft reported its results for the fourth quarter of fiscal year 2026. Revenue reached $90 billion, up 18% year-on-year, while adjusted earnings per share came in at $4.74, comfortably ahead of analysts' expectations of $4.

EUR/USD: All Eyes on the Fed as the Range Reaches Its Breaking Point
The dollar's next move hinges on tonight's Fed decision, and this time markets genuinely don't know what to expect. While economists still lean toward a hold—with CME FedWatch odds sitting near 68.5% for no change—Kevin Warsh's hawkish