


FXOpen

Today’s USD/JPY chart indicates that the U.S. dollar has strengthened against the yen by over 6.6% since the beginning of the month. Starting this trading week, the rate has surpassed 153 yen per dollar, a level not seen since August 31.
This bullish sentiment towards the dollar has been driven by the outcome of Japan’s parliamentary elections over the weekend. According to Reuters, investors believe that the loss of the ruling coalition’s majority in Japan’s parliament reduces the likelihood of a future interest rate hike, contributing to the yen's weakening.
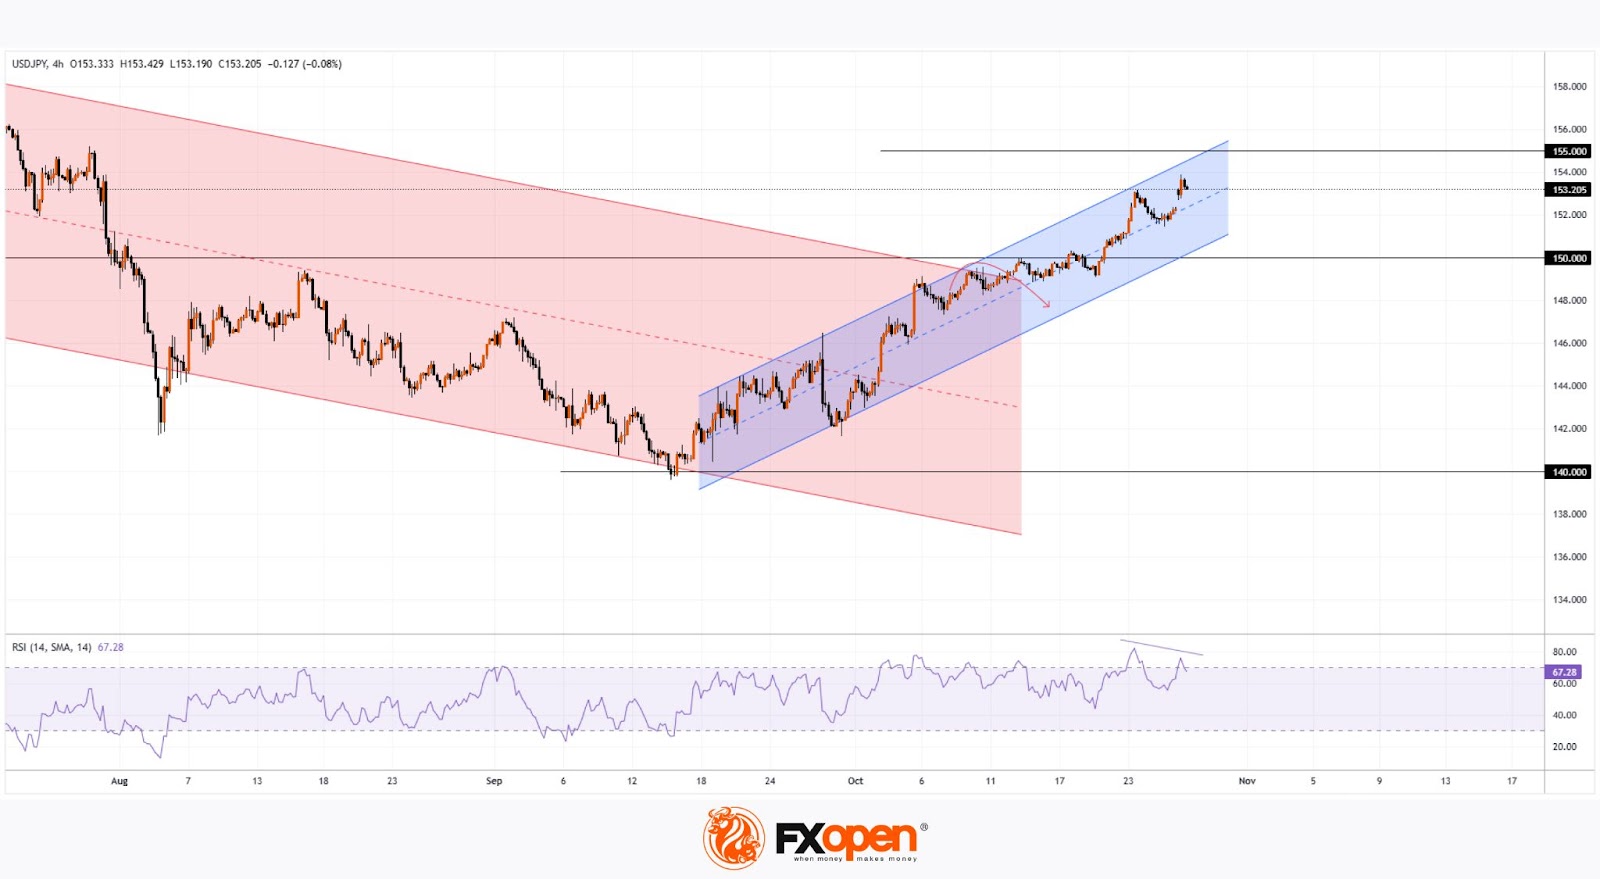
On October 10, there was speculation that bears might halt the October rally (marked by the blue channel) and guide the rate back down within a descending channel from its upper boundary (marked in red), with the psychological level of 150 yen per dollar acting as resistance.
However, bulls maintained their momentum (which originated from the psychological level of 140 yen) and continued the rally, breaking through this resistance. Per USD/JPY technical analysis, the 150 yen level may now serve as a support line.
The RSI indicator currently suggests the formation of a potential bearish divergence, hinting that a slight correction might occur as the market anticipates key upcoming news, which could heavily influence the sustainability of the current USD/JPY rally:
→ The Bank of Japan’s interest rate decision, expected on Thursday
→ Key U.S. labor market data releases scheduled for later in the week
Trade over 50 forex markets 24 hours a day with FXOpen. Take advantage of low commissions, deep liquidity, and spreads from 0.0 pips (additional fees may apply). Open your FXOpen account now or learn more about trading forex with FXOpen.
This article represents the opinion of the Companies operating under the FXOpen brand only. It is not to be construed as an offer, solicitation, or recommendation with respect to products and services provided by the Companies operating under the FXOpen brand, nor is it to be considered financial advice.
Stay ahead of the market!
Subscribe now to our mailing list and receive the latest market news and insights delivered directly to your inbox.


Latest articles

Market Analysis: GBP/USD Dips Further As EUR/GBP Regains Traction
GBP/USD failed to climb above 1.3500 and corrected some gains. EUR/GBP started a decent increase and might aim for more gains above 0.8700.
Important Takeaways for GBP/USD and EUR/GBP Analysis Today
· The British Pound


Market Insights with Gary Thomson: Oil, US Retail Sales & NFP in Focus
In this video, we’ll explore the key economic events and market trends, shaping the financial landscape. Get ready for insights into financial markets to help you navigate the week ahead. Let’s dive in!
In this episode of Market