


A Guide for Trading Divergences
FXOpen

Divergences were born from the desire of having an alternative to chaotic price movements. Since the Personal Computer (PC) invention, traders find it easier to plot charts and calculate complicated oscillators using sophisticated mathematical formulas.
An oscillator appears at the bottom of the main chart and considers many periods before plotting a value. For this reason, oscillators are more trustful than the actual price.
Hence, traders rely more on what an oscillator shows rather than what the price does. Divergences appeared as a consequence of comparing the moves of a currency pair with the ones of an oscillator.
What Makes a Divergence
A divergence appears when the oscillator doesn’t confirm the price moves. In other words, one is lying, and most of the times that’s the price.
The easiest way to spot a divergence is to look at the price and the oscillator’s moves in tandem. The oscillator should follow the price’s every move. Hence, every higher high or lower low seen in the actual price should reflect in the oscillators move too.
When not, the oscillator diverges.
Typically, oscillators come with an overbought and oversold area. Effectively, it means that when an oscillator prints values beyond overbought and oversold, the price has the tendency to retrace that move.
For this reason, when a divergence forms into the overbought or oversold territory, it is considered to be even more powerful than otherwise.
As the most popular oscillator, the Relative Strength Index (RSI) shows overbought and oversold conditions when its values stretch beyond the 70 and 30 level. Hence, any divergence that forms into that territory is enough for traders to consider a reversal.
In the case below, the RSI is applied on the recent AUD/USD currency pair. The Aussie part is a major currency pair part of the Forex dashboard, having significant liquidity and volatility to make it attractive to speculation.
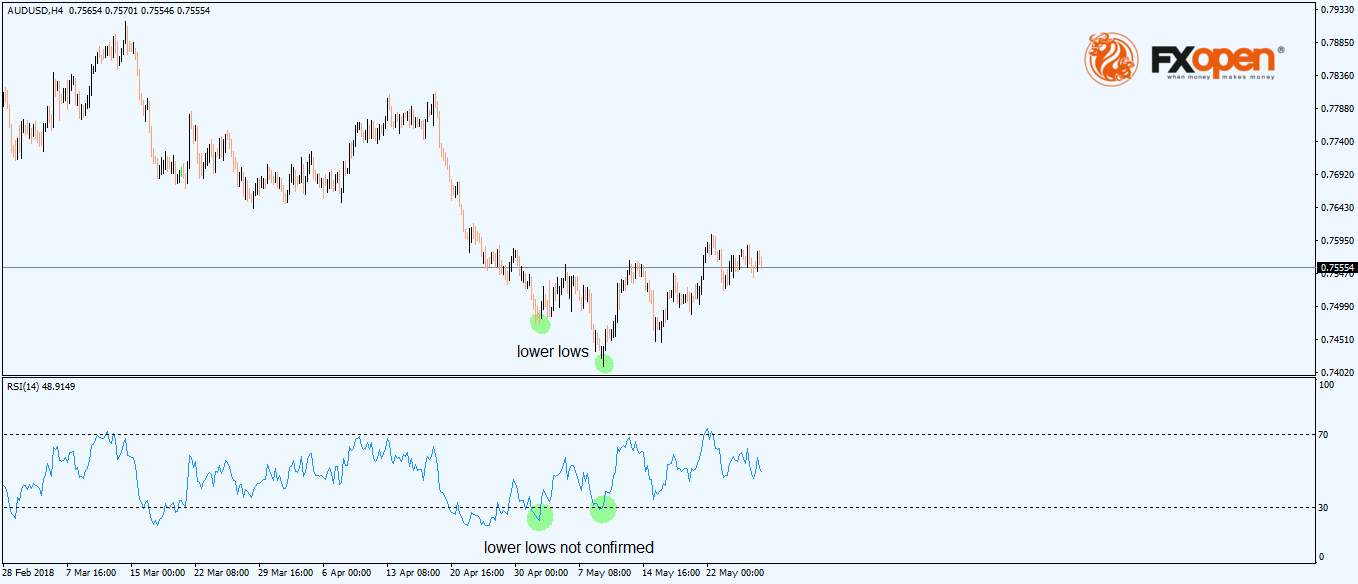
While the pair made two consecutive lower lows, the RSI failed to confirm the second one. This is enough for a divergence and, in this case, this is called a bullish divergence because it forms at the end of a bearish trend.
How to Trade Divergences: Forex Divergence Strategy
Trading a divergence is tricky as the market may remain in a divergent mode far longer than a trader remains solvent. As such, merely going long when a bullish divergence or short on a bearish divergence doesn’t guarantee success.
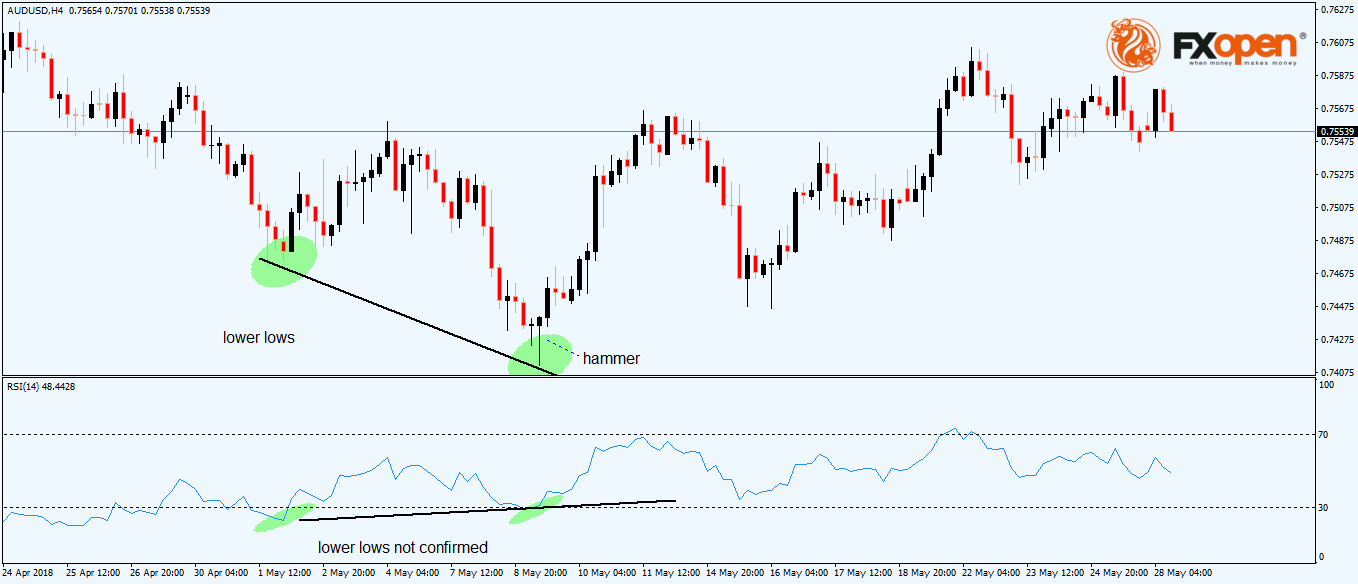
Hence, traders look for additional reasons or clues to come to support the information given by the bullish or bearish divergence. Because divergences appear before a reversal, traders use reversal patterns combined with divergences.
In this case, the market formed a hammer at the end of the second lower low, reinforcing the reversal conditions.
Conclusion
Divergences work great in ranging markets, but they also appear at the end of strong trends. For this reason, trading a divergence is riskier because traders take a position against the dominant price action.
Money management is key when trading divergences. Look for confirmation from a different reversal pattern (Japanese candlesticks patterns like a hammer, shooting stars, morning and evenings stars, bullish or bearish engulfing, Doji, etc. or classic reversal patterns like head and shoulders or rising and falling wedges) to complement the trade showed by a bullish or bearish divergence.
This article represents the opinion of the Companies operating under the FXOpen brand only. It is not to be construed as an offer, solicitation, or recommendation with respect to products and services provided by the Companies operating under the FXOpen brand, nor is it to be considered financial advice.
Stay ahead of the market!
Subscribe now to our mailing list and receive the latest market news and insights delivered directly to your inbox.

Latest articles

GBP/CHF: Trendline or RSI — Which One Is Lying?
Sterling enters this week on firmer footing, with political uncertainty fading fast after Andy Burnham's confirmation as Labour leader eased investor concerns over the succession to Keir Starmer. Markets reacted further to reports pointing to Shabana Mahmood as the frontrunner

Silver Attempts to Break Out of Its Range
Silver continues to balance between its dual role as an industrial metal and so-called refuge asset, and this combination largely explains the lack of a clear trend in recent weeks. Shifting expectations for central bank interest rates can influence the

Nasdaq 100: Is This the Correction Traders Have Been Waiting For?
The Nasdaq 100 (US Tech 100 Mini on FXOpen) remains caught between two opposing forces: cooling inflation on one side, and persistent geopolitical instability on the other. On 14 July, June's CPI print came in softer than expected, easing near-term