


USD/JPY Climbs Towards a Key High
FXOpen

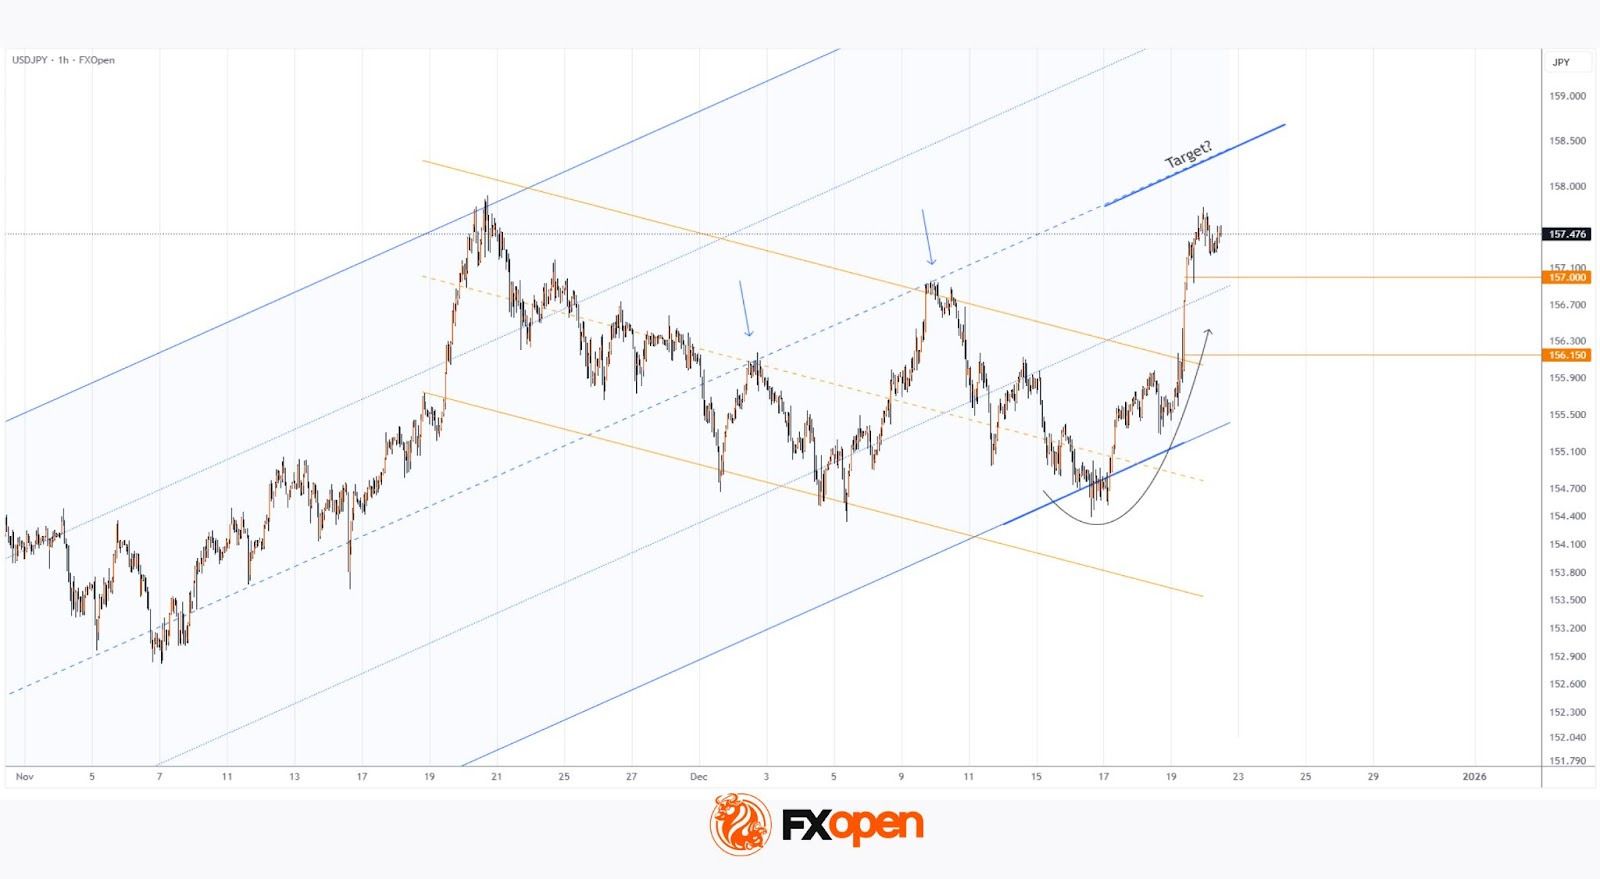
On 15 December, we highlighted that USD/JPY was sliding towards a key support area near the lower boundary of its ascending channel.
Since then (as shown by the arrow), the pair has reversed higher, gaining around 1.5% and moving close to an important high set last month.
Notably, the advance has occurred despite two bearish factors:
→ last Friday’s interest-rate increase to 0.75%, the highest level in 30 years;
→ the ongoing risk of currency intervention aimed at supporting the yen.
It appears that the rate hike had already been priced in, while traders focused on the relatively dovish tone of the Bank of Japan’s comments following the decision. At the same time, the threat of intervention is largely being viewed as rhetorical rather than imminent.
Technical Analysis of the USD/JPY Chart
From a technical perspective:
→ the decline since 20 November resembles a bullish flag correction pattern;
→ the forceful breakout above its upper boundary suggests growing confidence among buyers in a continuation of the uptrend, after successfully keeping the pair within the broader channel that has been in place since September.
It cannot be ruled out that:
→ in the short term, the channel’s median line (which previously acted as resistance) could serve as the next upside target;
→ support may be provided by the acceleration zone — a sign of buyer-side imbalance — between 156.15 (the breakout level) and the 157 yen-per-dollar mark.
Trade over 50 forex markets 24 hours a day with FXOpen. Take advantage of low commissions, deep liquidity, and spreads from 0.0 pips (additional fees may apply). Open your FXOpen account now or learn more about trading forex with FXOpen.
This article represents the opinion of the Companies operating under the FXOpen brand only. It is not to be construed as an offer, solicitation, or recommendation with respect to products and services provided by the Companies operating under the FXOpen brand, nor is it to be considered financial advice.
Stay ahead of the market!
Subscribe now to our mailing list and receive the latest market news and insights delivered directly to your inbox.


Latest articles

Market Analysis: GBP/USD Holds Firm, USD/CAD Bulls Target Breakout Move
GBP/USD started a downside correction from 1.3480. USD/CAD is gaining bullish momentum and might clear 1.3880 for more upside.
Important Takeaways for GBP/USD and USD/CAD Analysis Today
· The British Pound rallied toward 1.3500


Market Repricing of Risk as Gold Loses Safe-Haven Demand
Geopolitical tensions in the Middle East had remained the primary macro driver for the gold market over recent weeks; however, on 8 April the situation shifted sharply as the United States and Iran agreed to a temporary two-week ceasefire, including