


USD/JPY Drops by More Than 1% At the Start of the Week
FXOpen

As the USD/JPY chart shows, the pair has been exhibiting bearish momentum since the beginning of the week. This move has been driven by a combination of factors:
→ Yen strength on political news. Prime Minister Sanae Takaichi secured a decisive victory in Sunday’s snap election (8 February), winning a parliamentary majority. Although Takaichi has pledged large-scale fiscal stimulus of around ¥21 trillion, the prospect of increased money printing has not weakened the currency, as the market may (a) welcome political stability and (b) believe that the Bank of Japan will be forced to respond to inflation by raising interest rates.
→ US dollar weakness ahead of economic data releases. This reflects market sentiment ahead of labour market data due on Wednesday and the CPI report scheduled for Friday. In addition, the dollar’s status has come under pressure after Chinese regulators reportedly recommended limiting investments in US Treasuries.
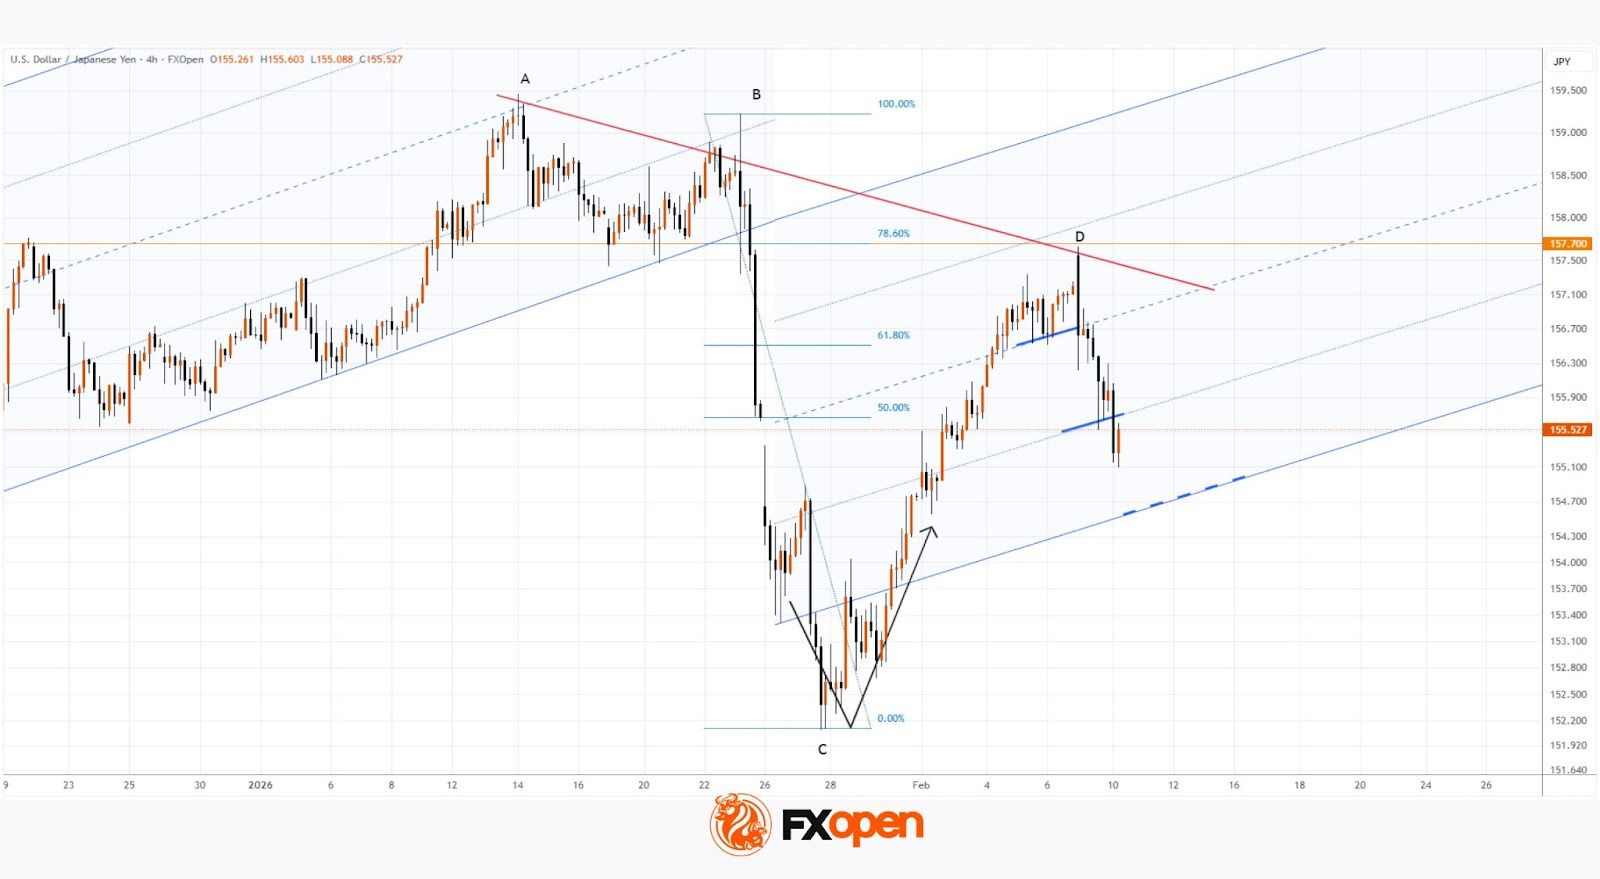
On 26 January, when analysing fluctuations in the dollar–yen exchange rate, we:
→ noted that the long-term ascending channel had been broken near the 157.700 level;
→ constructed a parallel channel below and suggested that, following the sharp drop in USD/JPY (triggered by the possibility of coordinated currency intervention by the Bank of Japan and the Federal Reserve), a rebound could occur.
Indeed, since then (as indicated by the arrow):
→ on 28 January, the market formed a low slightly below the lower boundary of the parallel channel;
→ the pair subsequently rebounded towards the 157.700 level.
Technical Analysis of the USD/JPY Chart
The bearish tone of the current week allows us to highlight the following:
→ local support levels of the parallel channel (shown by thick blue lines) have been broken, and bulls may now have to rely on its lower boundary;
→ lower highs A–B–D have formed on the USD/JPY chart, with a bearish trend line drawn through them.
In this context, it is reasonable to assume that:
→ the sharp B→C impulse has disrupted the market’s multi-month bullish structure;
→ the C→D recovery (towards the 78.6% Fibonacci level) was an interim move within a broader bearish reversal.
The ability of the red A–B–D trend line to remain relevant over time would further support this hypothesis.
Trade over 50 forex markets 24 hours a day with FXOpen. Take advantage of low commissions, deep liquidity, and spreads from 0.0 pips (additional fees may apply). Open your FXOpen account now or learn more about trading forex with FXOpen.
This article represents the opinion of the Companies operating under the FXOpen brand only. It is not to be construed as an offer, solicitation, or recommendation with respect to products and services provided by the Companies operating under the FXOpen brand, nor is it to be considered financial advice.
Stay ahead of the market!
Subscribe now to our mailing list and receive the latest market news and insights delivered directly to your inbox.


Latest articles

NVIDIA: Kyber NVL144 Dispute Weighs on the Stock
NVIDIA shares found themselves at the centre of debate over the future of the Kyber NVL144 system. On 6 July, CNBC, citing research firm SemiAnalysis, reported that the project could be delayed by more than a year—from 2027 to

EUR/GBP: Trendline Support or Breakdown to New Lows?
EUR/GBP has slid to its weakest level in a year, as the two currencies continue to follow increasingly divergent paths. The ECB's June hike—its first since 2023—was meant to signal renewed hawkishness, but the very next inflation

USD/CAD: One Trendline Away From Deciding the Next Move
After several strongly positive weeks, USD/CAD has stalled over the past few sessions, entering a phase of uncertainty.
On the dollar side, Fed Chair Kevin Warsh has struck a firm tone, reaffirming the 2% inflation target and pushing back