


USD/JPY Pulls Back After a Period of Gains
FXOpen

As the USD/JPY chart shows, the pair posted solid bullish momentum in the second half of February. This move was driven by a combination of fundamental factors, including:
→ The appointment of two academics to the central bank’s board, both regarded as strong advocates of economic stimulus through a weaker yen and accommodative lending conditions.
→ Concerns over further interest rate hikes, voiced by Japanese Prime Minister Sanae Takaichi during a meeting with Bank of Japan Governor Kazuo Ueda.
Expectations of a softer yen led to renewed weakness in the currency (A→B), forming the upward trajectory highlighted in purple.
However, on Wednesday the pair retreated, which appears to be an interim pullback from point B. Technical analysis of the USD/JPY chart suggests that extending the move along the purple trajectory may prove challenging.
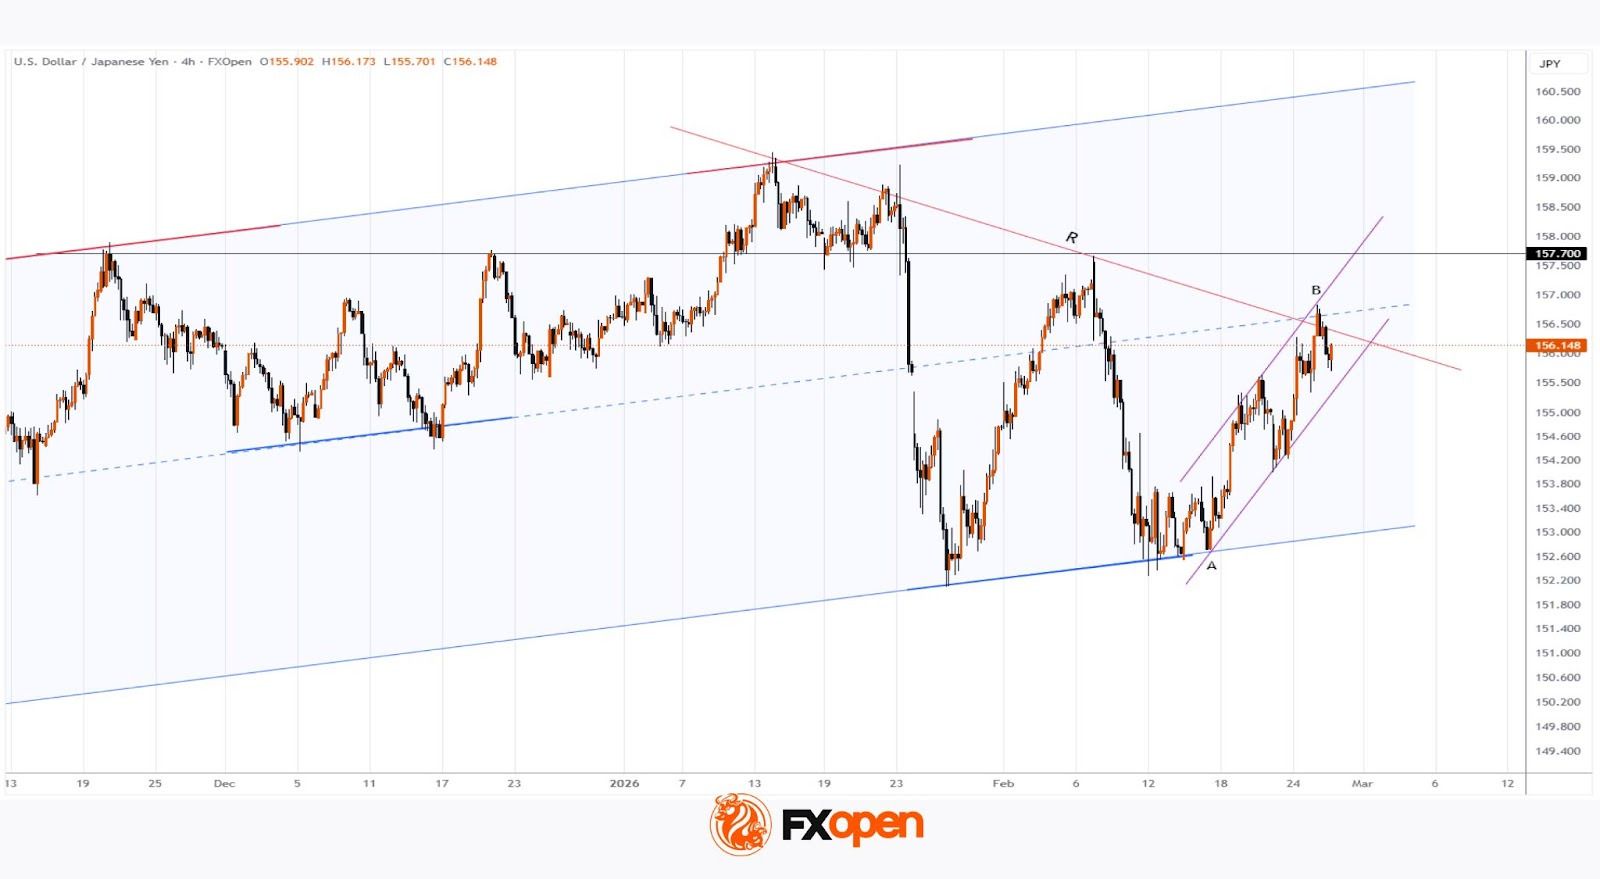
Factors that could favour the bears include:
→ The median line of the ascending channel (constructed from key reversal points marked by thicker lines). The median often acts as a balance zone where supply and demand converge and trends lose momentum.
→ The proximity of the significant 157.70 resistance level, which already acted as resistance in 2025. Although price broke above it in January 2026 (with the level briefly showing signs of support), following the sharp sell-off on 23 January it once again served as a barrier for bulls on 9 February.
→ Trend line R, drawn through the lower highs of 2026.
Therefore, it cannot be ruled out that the lower purple boundary may be breached by bears, potentially leading the market into a period of consolidation while awaiting fresh economic and political catalysts.
Trade over 50 forex markets 24 hours a day with FXOpen. Take advantage of low commissions, deep liquidity, and spreads from 0.0 pips (additional fees may apply). Open your FXOpen account now or learn more about trading forex with FXOpen.
This article represents the opinion of the Companies operating under the FXOpen brand only. It is not to be construed as an offer, solicitation, or recommendation with respect to products and services provided by the Companies operating under the FXOpen brand, nor is it to be considered financial advice.
Stay ahead of the market!
Subscribe now to our mailing list and receive the latest market news and insights delivered directly to your inbox.


Latest articles


Market Repricing of Risk as Gold Loses Safe-Haven Demand
Geopolitical tensions in the Middle East had remained the primary macro driver for the gold market over recent weeks; however, on 8 April the situation shifted sharply as the United States and Iran agreed to a temporary two-week ceasefire, including

Commodity Currencies on the Rise: Market Focus Shifts to US and Canadian Data
Commodity-linked currencies continue to strengthen, while the US dollar remains under pressure amid easing geopolitical tensions and a shift in investor preference towards riskier assets. Reports of a temporary ceasefire between the US and Iran have helped stabilise sentiment and