


USD/JPY Rises to Highest Since 1990
FXOpen
This morning the USD/JPY rate is around 153.20 yen per US dollar, which was facilitated by a sharp strengthening of the dollar against the backdrop of news about inflation in the United States. Thus, the yen weakened to levels last seen in mid-1990.
At the same time, an important event occurred — a bullish breakdown of the level of 152 yen per US dollar. This level is special due to the fact that in 2022, the weakening of the exchange rate to 152 yen per US dollar forced the Bank of Japan and the Ministry of Finance to intervene three times, as Reuters writes, to support the yen.
In 2023, it also acted as a barrier to growth. It also held back the market during March 2024 and early April.
But yesterday the level of 152 yen per US dollar did not survive.
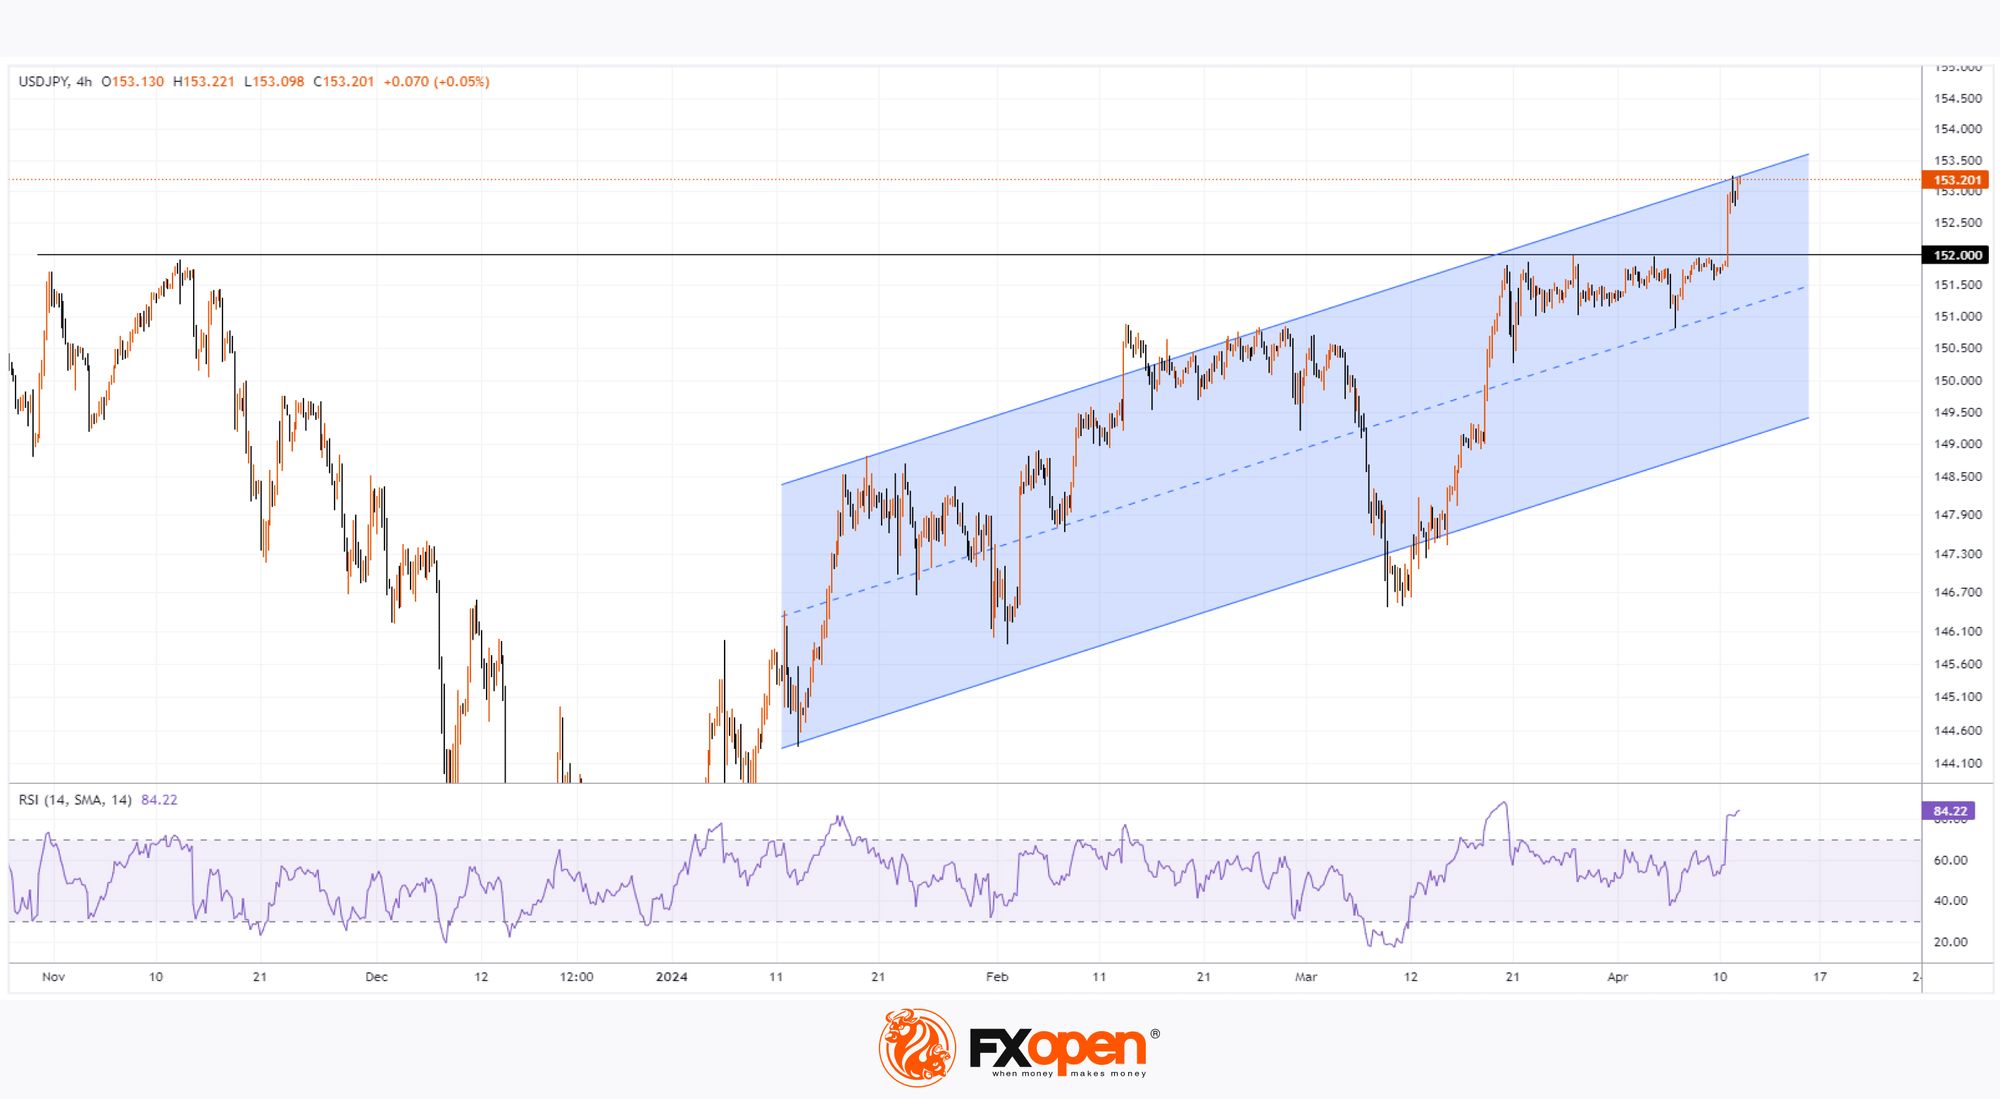
At the same time, technical analysis of the USD/JPY chart today shows that:
→ the price has reached the upper boundary of the ascending channel (shown in blue), now it demonstrates its role as resistance;
→ the RSI indicator indicates that the market is strongly overbought.
At the same time, it can be assumed that the likelihood of interventions has increased, since the Japanese authorities, as stated earlier, do not rule out any steps to combat excessive fluctuations.
Considering what was written above, it is possible to assume that the USD/JPY rate may form a pullback after a strong bullish impulse, and the level of 152 looks like new support.
Trade over 50 forex markets 24 hours a day with FXOpen. Take advantage of low commissions, deep liquidity, and spreads from 0.0 pips (additional fees may apply). Open your FXOpen account now or learn more about trading forex with FXOpen.
This article represents the opinion of the Companies operating under the FXOpen brand only. It is not to be construed as an offer, solicitation, or recommendation with respect to products and services provided by the Companies operating under the FXOpen brand, nor is it to be considered financial advice.
Stay ahead of the market!
Subscribe now to our mailing list and receive the latest market news and insights delivered directly to your inbox.


Latest articles

AI Valuations Are Back in the Spotlight
Artificial intelligence remains the dominant investment theme of 2026, but investors are increasingly questioning whether AI stock valuations are keeping pace with reality.
💰 Big Tech continues to invest at an unprecedented scale, with hyperscaler AI spending projected to exceed $800

AUD/CAD: Months of Indecision — Is a Breakout Finally Coming?
The Australian dollar has clawed back most of its end-of-June losses, when it touched three-month lows against the greenback amid escalating Middle East tensions. Since then, sentiment has improved: the RBA's Assistant Governor Sarah Hunter signalled the board stands ready

USD/JPY: Battling at the Top of the Triangle
On 3 July, Japan's Finance Minister, Satsuki Katayama, stated that the Ministry of Finance remains in close contact with US authorities regarding developments in USD/JPY as the yen traded near its weakest level in almost 40 years. Similar verbal