


USD/JPY Technical Analysis: Yen Strengthens after Comments from Japanese Officials
FXOpen

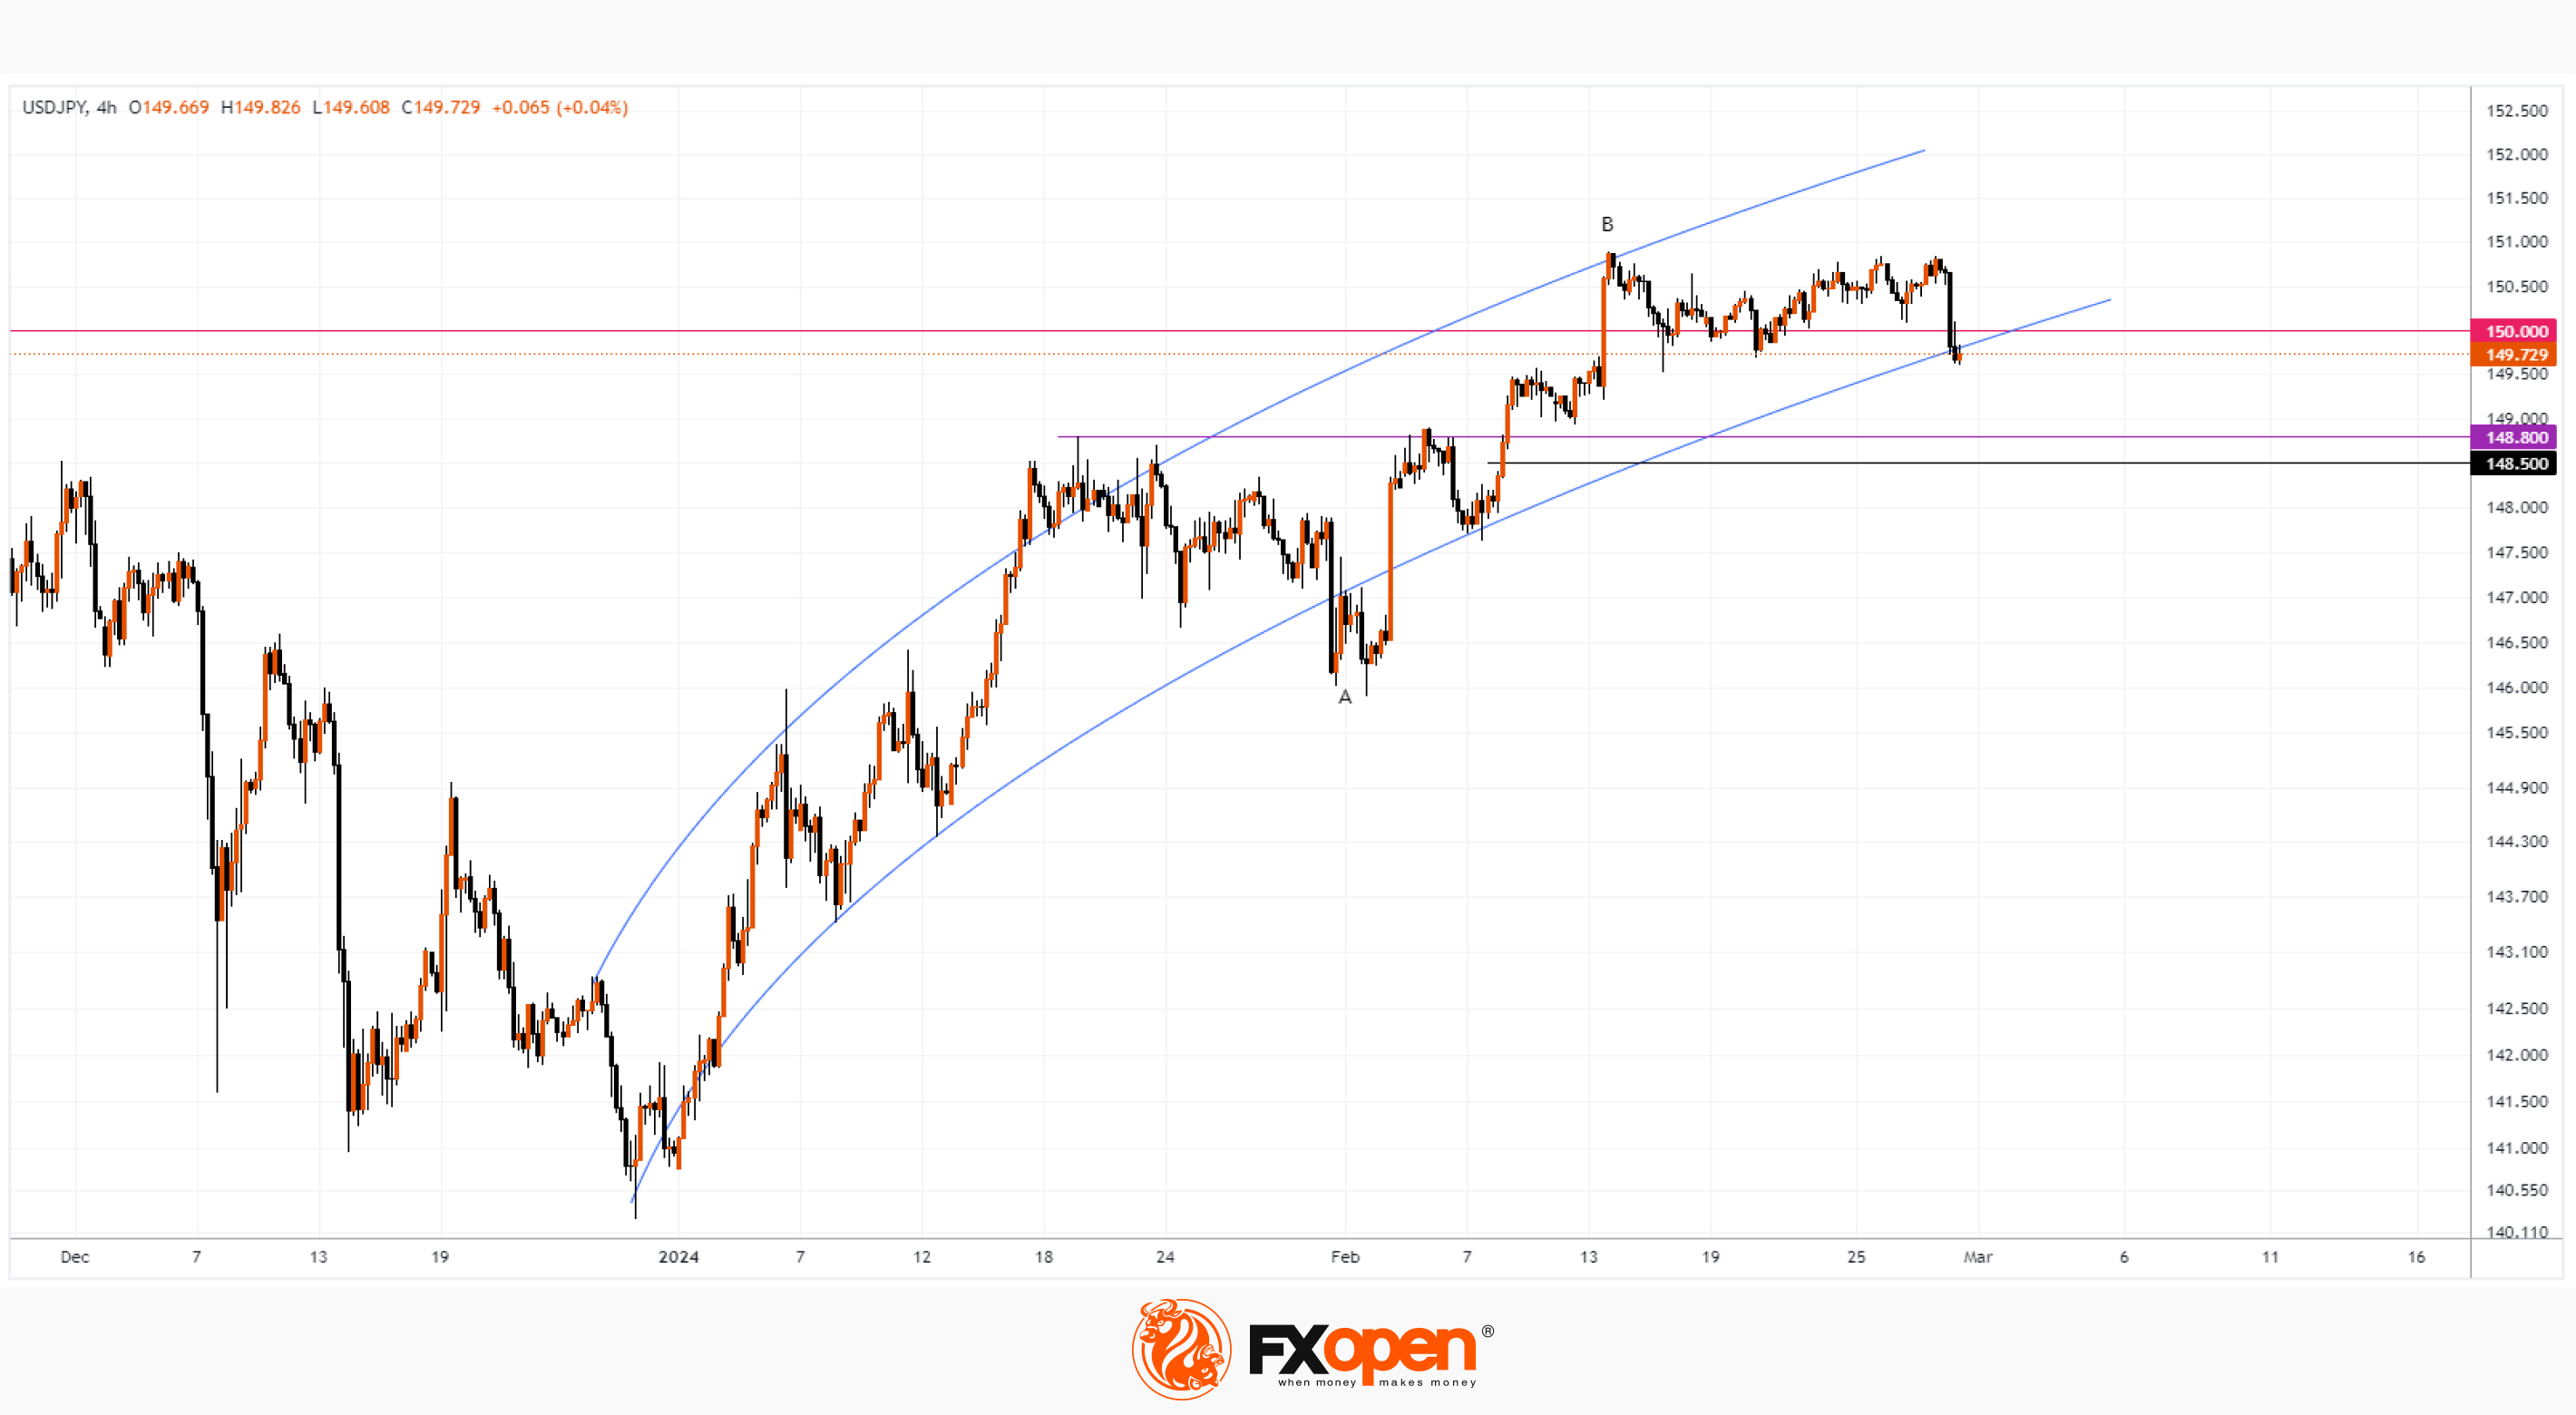
This week has raised alarm bells for USD/JPY market participants who are trading the bullish momentum that has been going on since early 2024 (shown in the blue curved lines on the USD/JPY chart):
→ Vice Finance Minister Masato Kanda warned against “excessive volatility” in currency markets, hinting that the yen had weakened too much.
→ Bank of Japan board member Hajime Takata said that, in his opinion, there are prospects for achieving the inflation target of 2%, which opens the way to abandoning negative rates. Note that today there was news on inflation in Japan, which showed that it is slowing down. Thus, BOJ Core CPI in annual terms was 2.6%, a month ago = 2.6%, 2 months ago = 2.7%, 3 months ago = 3.0%.
Statements from officials should increase the likelihood of a rate hike at the Bank of Japan's March meeting, thereby changing the prevailing sentiment.
Reuters writes that positions against the yen are at a record high, and their collapse could lead to the fact that the 2-month bullish trajectory of the USD/JPY price will be broken.
Wherein:
→ the psychological level factor of 150 yen per US dollar operates in the market — history shows that the fall of the yen below this level leads to a reaction from the Japanese financial authorities.
→ The USD/JPY price may fall to the support zone, which is formed by the level 148.50 (50% of the A→B impulse) and the level 148.8 (former resistance).
Trade over 50 forex markets 24 hours a day with FXOpen. Take advantage of low commissions, deep liquidity, and spreads from 0.0 pips (additional fees may apply). Open your FXOpen account now or learn more about trading forex with FXOpen.
This article represents the opinion of the Companies operating under the FXOpen brand only. It is not to be construed as an offer, solicitation, or recommendation with respect to products and services provided by the Companies operating under the FXOpen brand, nor is it to be considered financial advice.
Stay ahead of the market!
Subscribe now to our mailing list and receive the latest market news and insights delivered directly to your inbox.


Latest articles

Weekly Market Insights with Gary Thomson: The Week of Central Banks and Earnings
In this video, we’ll explore the key economic events and market trends, shaping the financial landscape. Get ready for insights into financial markets to help you navigate the week ahead. Let’s dive in!
In this episode of Market

Intel at a Crossroads: Earnings Beat Meets Technical Resistance
Intel has just delivered its strongest quarter in over fifteen years, and the market reaction says it all. Q2 2026 revenue surged 25% year-over-year to $16.1 billion, crushing the consensus estimate of $14.42 billion, while adjusted EPS of

Tesla: Complex Range Structure Breaks Down Following Quarterly Earnings
Tesla released its Q2 2026 results after the market closed on 22 July. Revenue increased 26% year-on-year to $28.24 billion, while vehicle deliveries reached a record 480,126 units. However, operating margin fell sharply to 1.4%, down from