


USD/JPY: The Price Reaches Resistance at 145 Yen per US Dollar
FXOpen
As of Friday morning, the situation on the USD/JPY market deserves attention:
→ the US dollar is on course to demonstrate its strongest week since July 2023. The media writes that markets are adjusting expectations regarding the easing of monetary policy by the Fed.
→ The yen fell about 3% against the US dollar in the first week of the year, which could be its weakest weekly performance since August 2022.
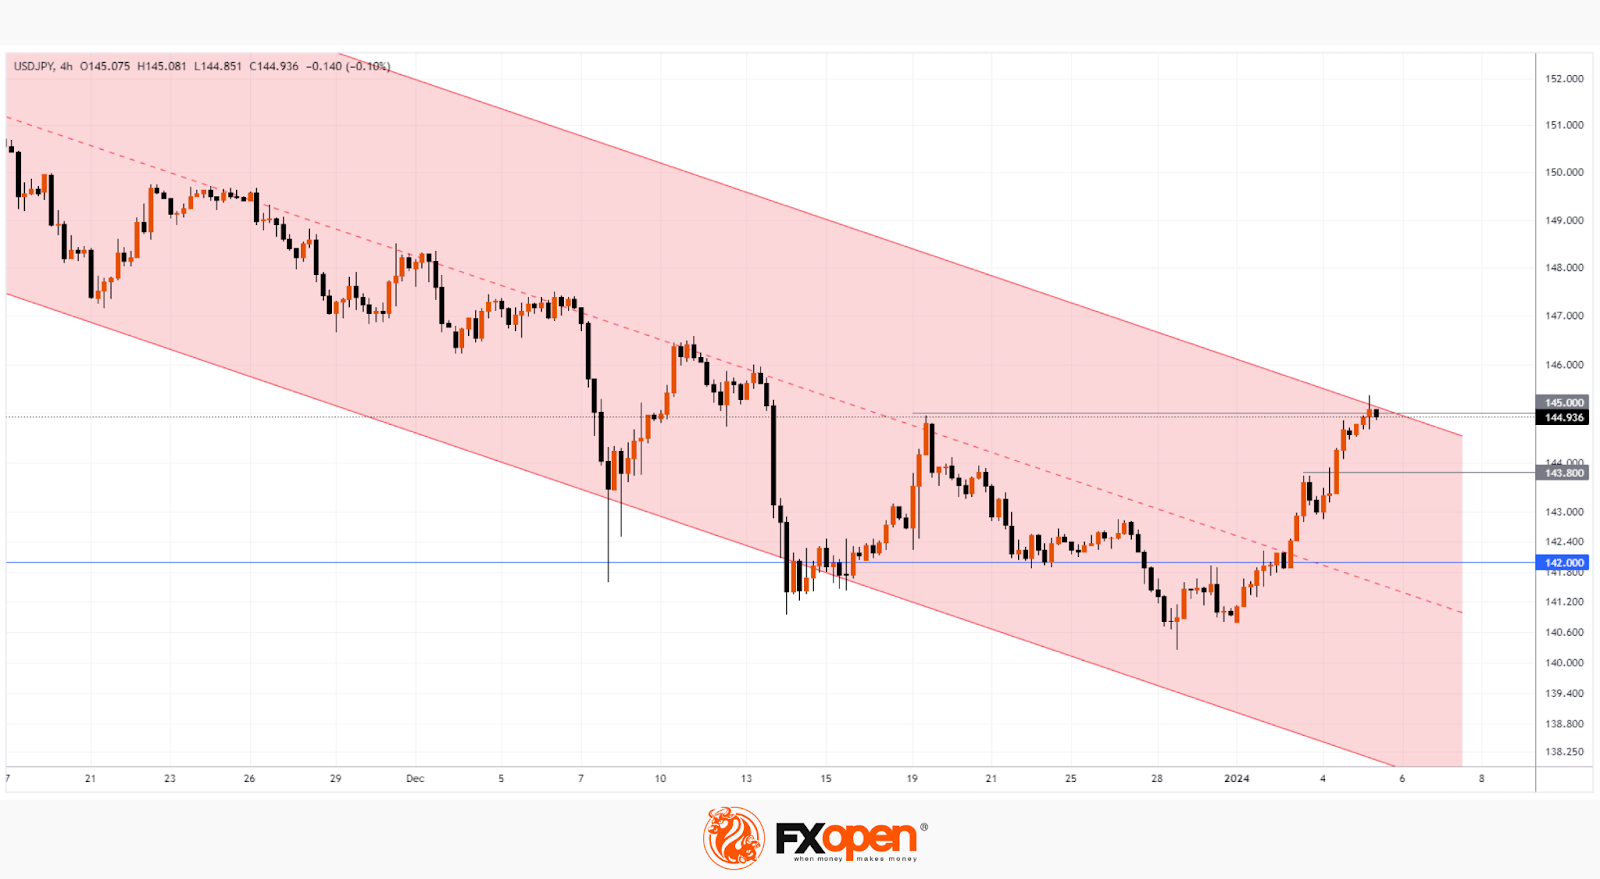
The USD/JPY chart shows that:
→ the price moves within the descending channel (shown in red). Growth at the beginning of the year expanded its boundaries along the principle of a parallel channel.
→ the median line has been broken by the bulls. The price action around 142 shows increased demand. The price could not consolidate below this level in December, serving as a powerful support for ending panic on December 7 and 14-15. Also, demand forces did not allow the price to reach the lower border of the channel on December 28.
Note that the bulls managed to break above the psychological level of 145, something they failed to do on December 19 when a notable high was formed. Thus, the market is in a vulnerable position for a pullback from the upper boundary of the channel after rapid growth in the first days of the year. If this happens, a false bullish breakout of the psychological level of 145 will form on the chart. The bears will have a chance to resume the trend, but given the listed signs of demand strength around the 142 yen per dollar level, they will have to make significant efforts to do this.
Be careful, today at 16:30 GMT+3 there will be news on the labour market in the US, which may affect the USD exchange rate.
Trade over 50 forex markets 24 hours a day with FXOpen. Take advantage of low commissions, deep liquidity, and spreads from 0.0 pips (additional fees may apply). Open your FXOpen account now or learn more about trading forex with FXOpen.
This article represents the opinion of the Companies operating under the FXOpen brand only. It is not to be construed as an offer, solicitation, or recommendation with respect to products and services provided by the Companies operating under the FXOpen brand, nor is it to be considered financial advice.
Stay ahead of the market!
Subscribe now to our mailing list and receive the latest market news and insights delivered directly to your inbox.


Latest articles

Brent Crude Oil: From Ceasefire to Crossfire — What's Next?
Just weeks ago, traders were pricing in peace. Now they're pricing in war again—and that reversal says everything about how fragile the current Middle East calm really is.
Brent crude has surged to $86 a barrel, its highest level

AUD/USD and USD/CAD React to Softer US Inflation
Commodity-linked currencies strengthened after US inflation data came in weaker than expected. The Consumer Price Index (CPI) slowed to 3.5% year-on-year in June, below the 3.8% forecast, while core inflation eased to 2.6% versus expectations of 2.

NVIDIA: Kyber NVL144 Dispute Weighs on the Stock
NVIDIA shares found themselves at the centre of debate over the future of the Kyber NVL144 system. On 6 July, CNBC, citing research firm SemiAnalysis, reported that the project could be delayed by more than a year—from 2027 to