


USDJPY Analysis: Calm Before the Storm?
FXOpen

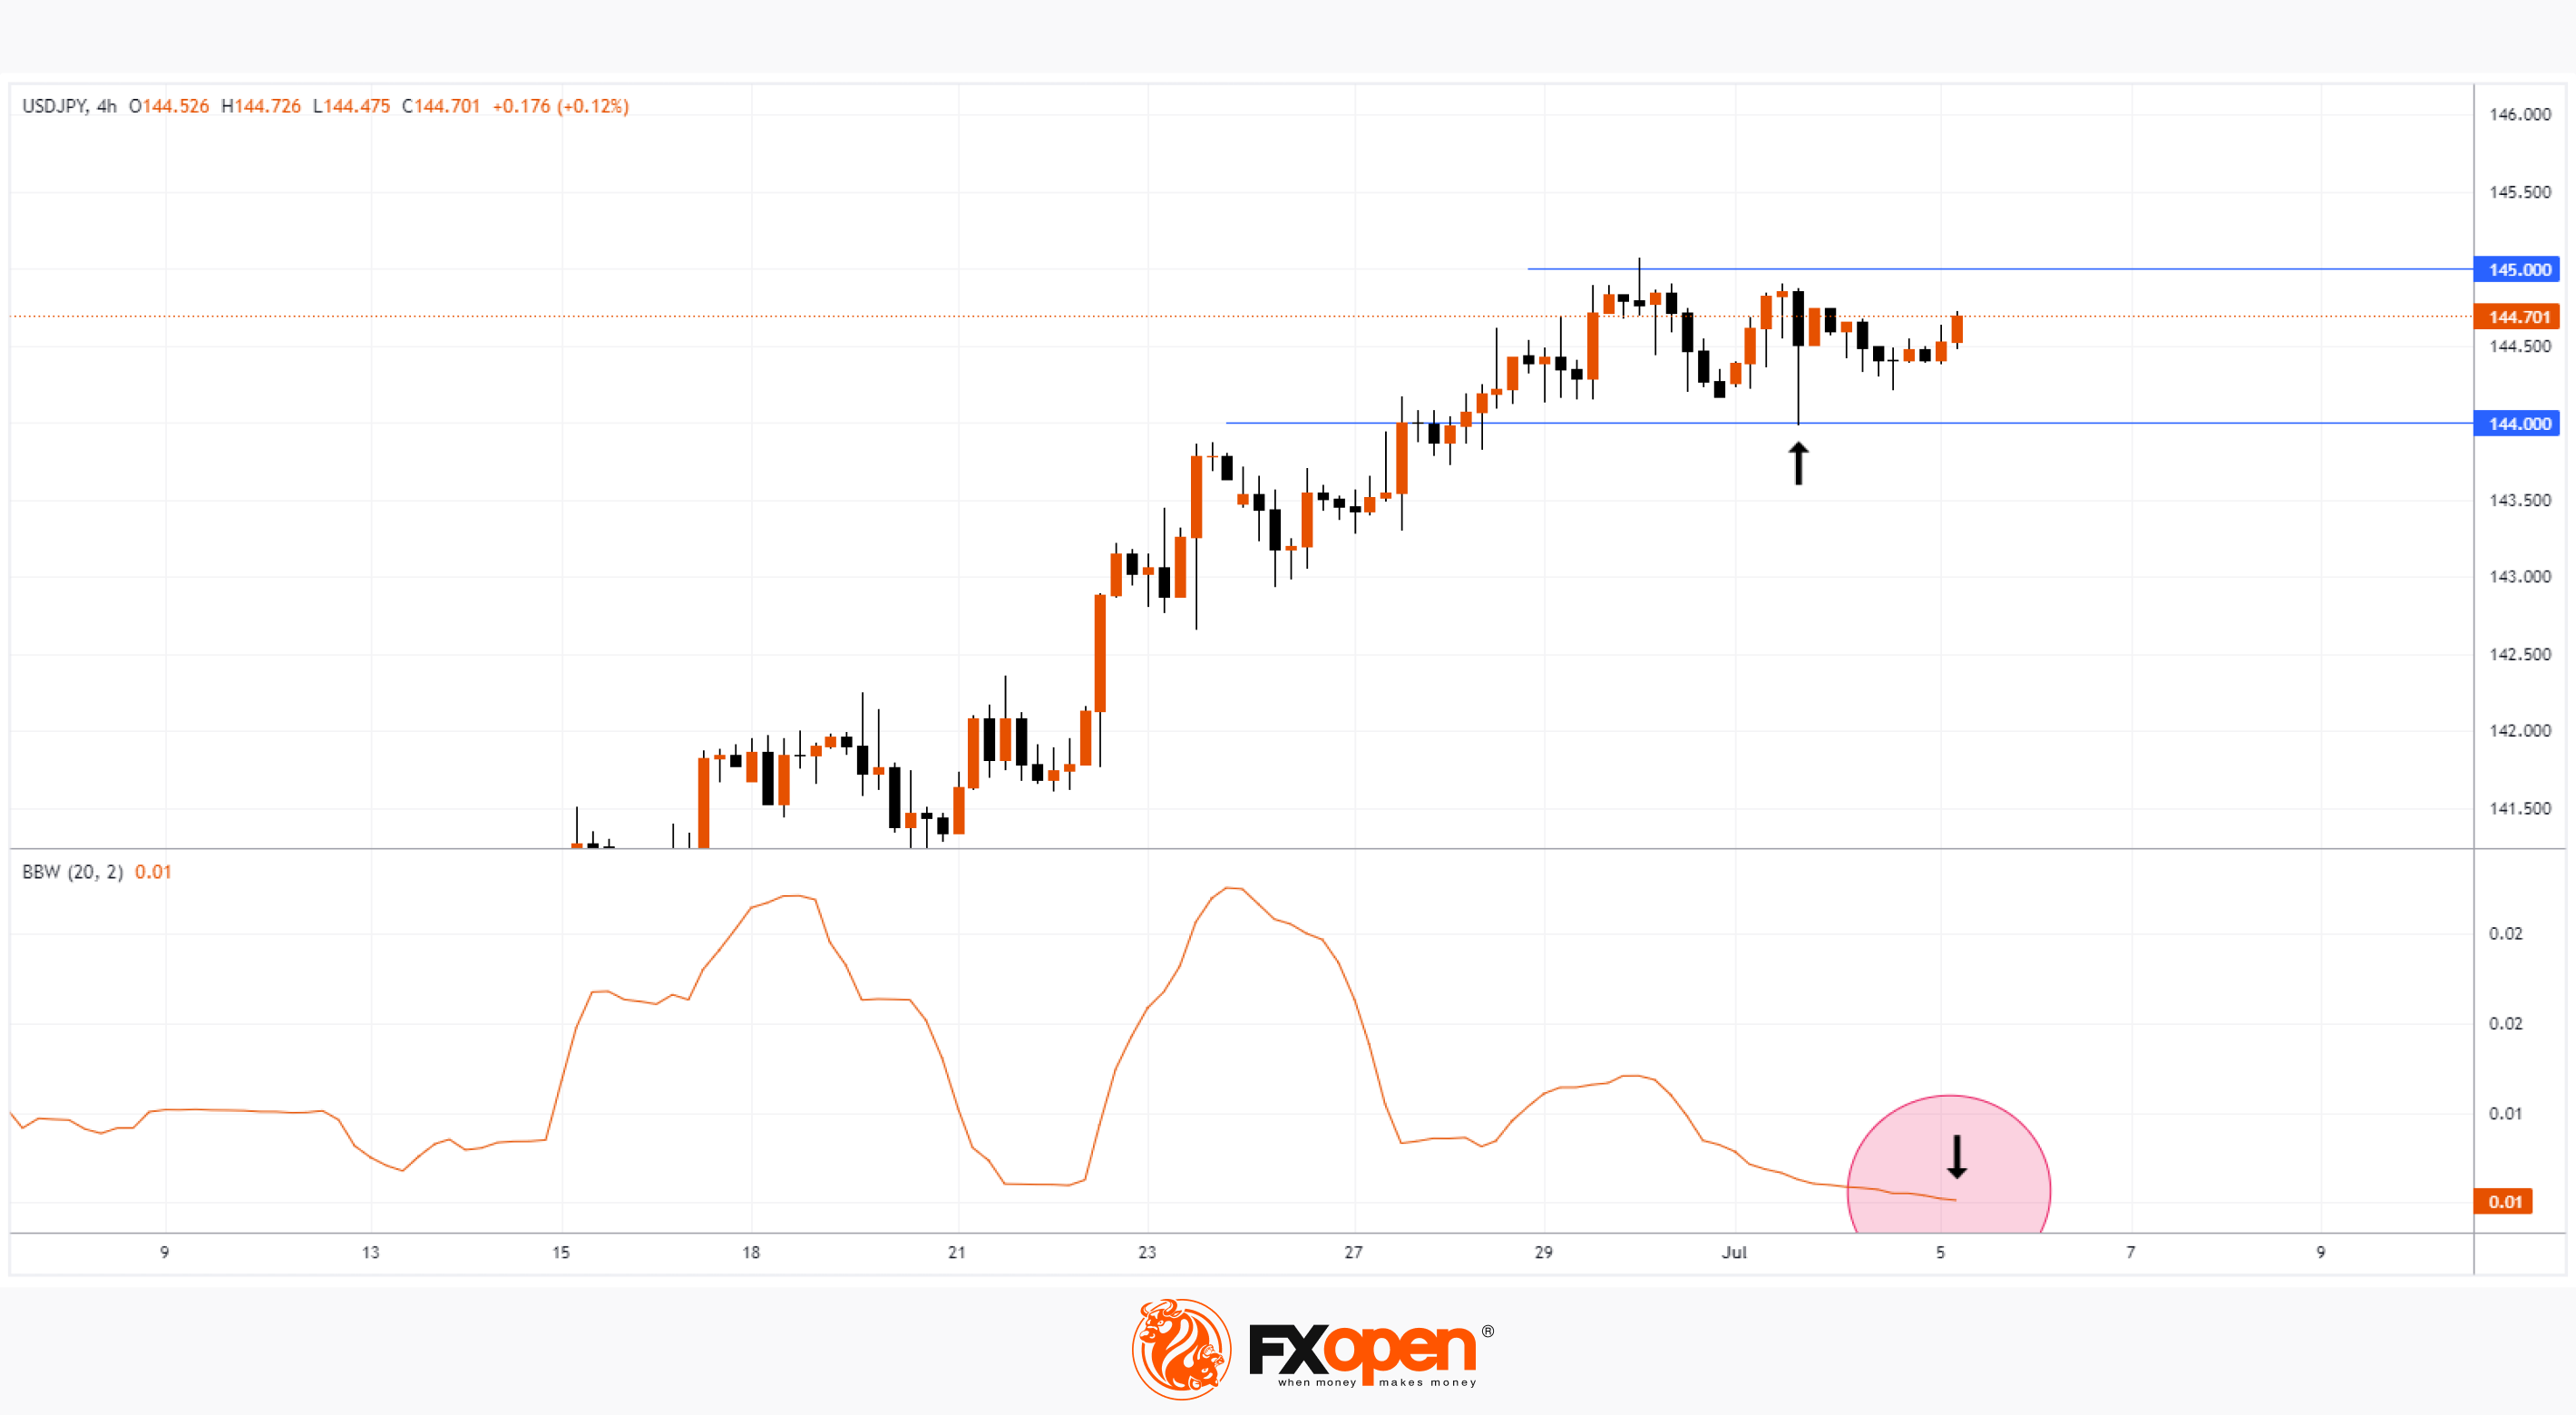
There is some lull (consolidation) in the USD/JPY market, which is evidenced by the width of the Bollinger bands, which dropped to the lows of the end of February on the 4-hour chart. Bank holidays in the US in connection with the celebration of Independence Day contributed to the decrease in volatility.
However, the calm could be replaced by a storm.
The USD/JPY chart shows that the bulls have tested the level of 144 and on the morning of July 5, the rate is gradually rising towards the level of 145 — technically this can be interpreted as a demand force for dollars.
Reuters reports the words of Shusuke Yamada, chief forex strategist at Bank of China, who believes that the market expects further weakening of the yen in the medium term. And this is important, because last fall, the level of 145 yen per US dollar was the trigger for intervention by the Bank of Japan.
Add here the news from the FOMC, which will be released today at 21:00 GMT+3, and you will get a set of drivers that can cause a surge in market volatility in July and an expansion of Bollinger bands.
Trade over 50 forex markets 24 hours a day with FXOpen. Take advantage of low commissions, deep liquidity, and spreads from 0.0 pips (additional fees may apply). Open your FXOpen account now or learn more about trading forex with FXOpen.
This article represents the opinion of the Companies operating under the FXOpen brand only. It is not to be construed as an offer, solicitation, or recommendation with respect to products and services provided by the Companies operating under the FXOpen brand, nor is it to be considered financial advice.
Stay ahead of the market!
Subscribe now to our mailing list and receive the latest market news and insights delivered directly to your inbox.


Latest articles

AUD/CAD: Months of Indecision — Is a Breakout Finally Coming?
The Australian dollar has clawed back most of its end-of-June losses, when it touched three-month lows against the greenback amid escalating Middle East tensions. Since then, sentiment has improved: the RBA's Assistant Governor Sarah Hunter signalled the board stands ready

USD/JPY: Battling at the Top of the Triangle
On 3 July, Japan's Finance Minister, Satsuki Katayama, stated that the Ministry of Finance remains in close contact with US authorities regarding developments in USD/JPY as the yen traded near its weakest level in almost 40 years. Similar verbal

Dow Jones (DJIA): Consolidation Beyond the Trend
Federal Reserve Chair Kevin Warsh testified before Congress on 14–15 July, reaffirming the Fed's commitment to bringing inflation back to target while providing no clear guidance on the future path of interest rates. Meanwhile, June inflation data came in